
Data Sources: HTA Monthly Visitor Statistics (2019–2026 YTD), Annual Visitor Research Report 2024, VSAT Q4 2025, Hotel Performance Reports, Vacation Rental Data, Traveler Profiles & Brand Health Reports
Analysis Date: April 2026 | All data sourced directly from official HTA published files
Executive Summary
Hawaii welcomed 9.53 million air visitors in 2024, generating $20.1 billion in total visitor expenditures — a market that has fully recovered from the COVID-19 disruption and is now tracking at 97.5% of its 2019 peak. For a premium tour operator, the data reveals a highly segmented market where a small number of high-value traveler types — honeymoon couples, corporate meeting attendees, incentive travel groups, and first-time visitors — generate disproportionate revenue per visitor, and where Kaua'i stands out as the island most structurally aligned with premium positioning.
The 2026 year-to-date data (January–February) shows arrivals running +2.1% above the 2025 pace, suggesting continued growth in the base case. However, the historical recession analysis demonstrates that Hawaii is meaningfully exposed to US economic downturns, with prior recessions causing 9–14% visitor volume declines over 1–2 years. The premium and MCI segments have historically proven more resilient than the mass leisure market.
Path 1: Visitor Volume & Trends
Long-Run Recovery and Market Structure
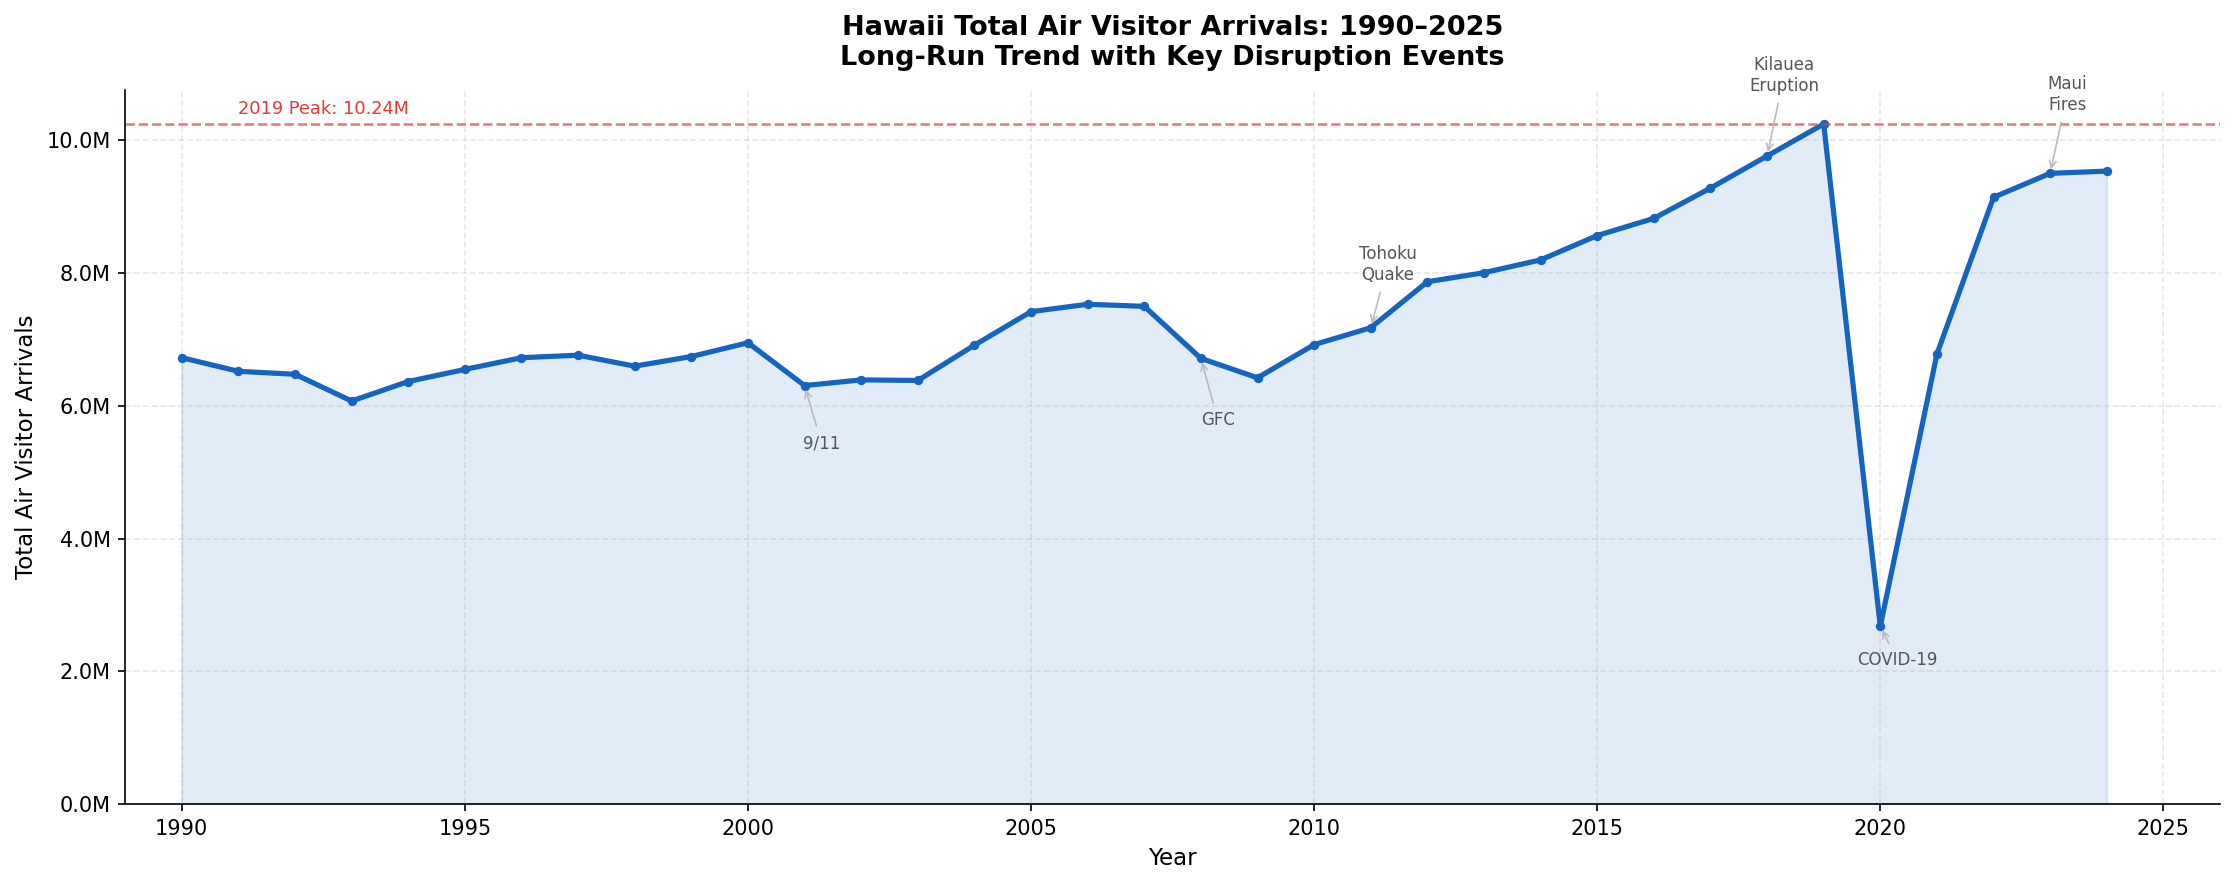
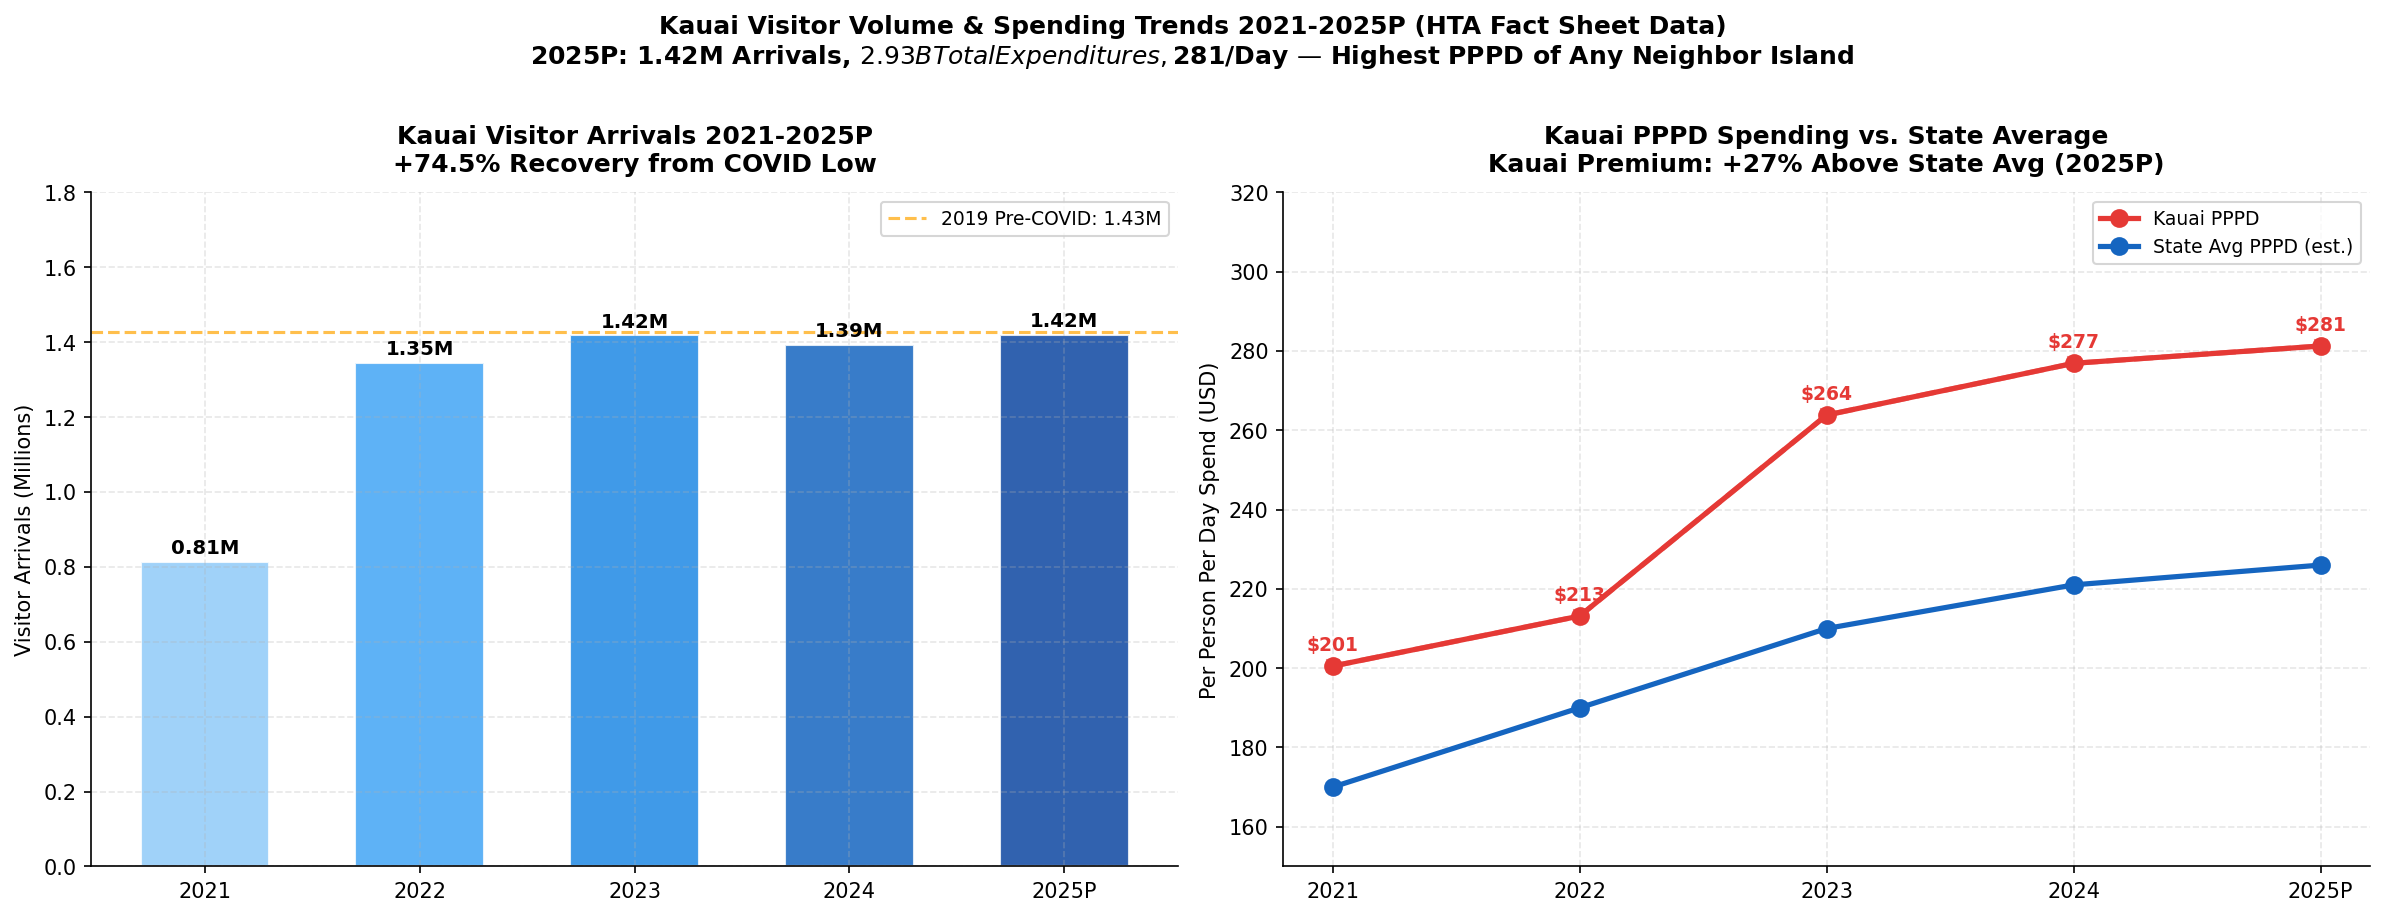
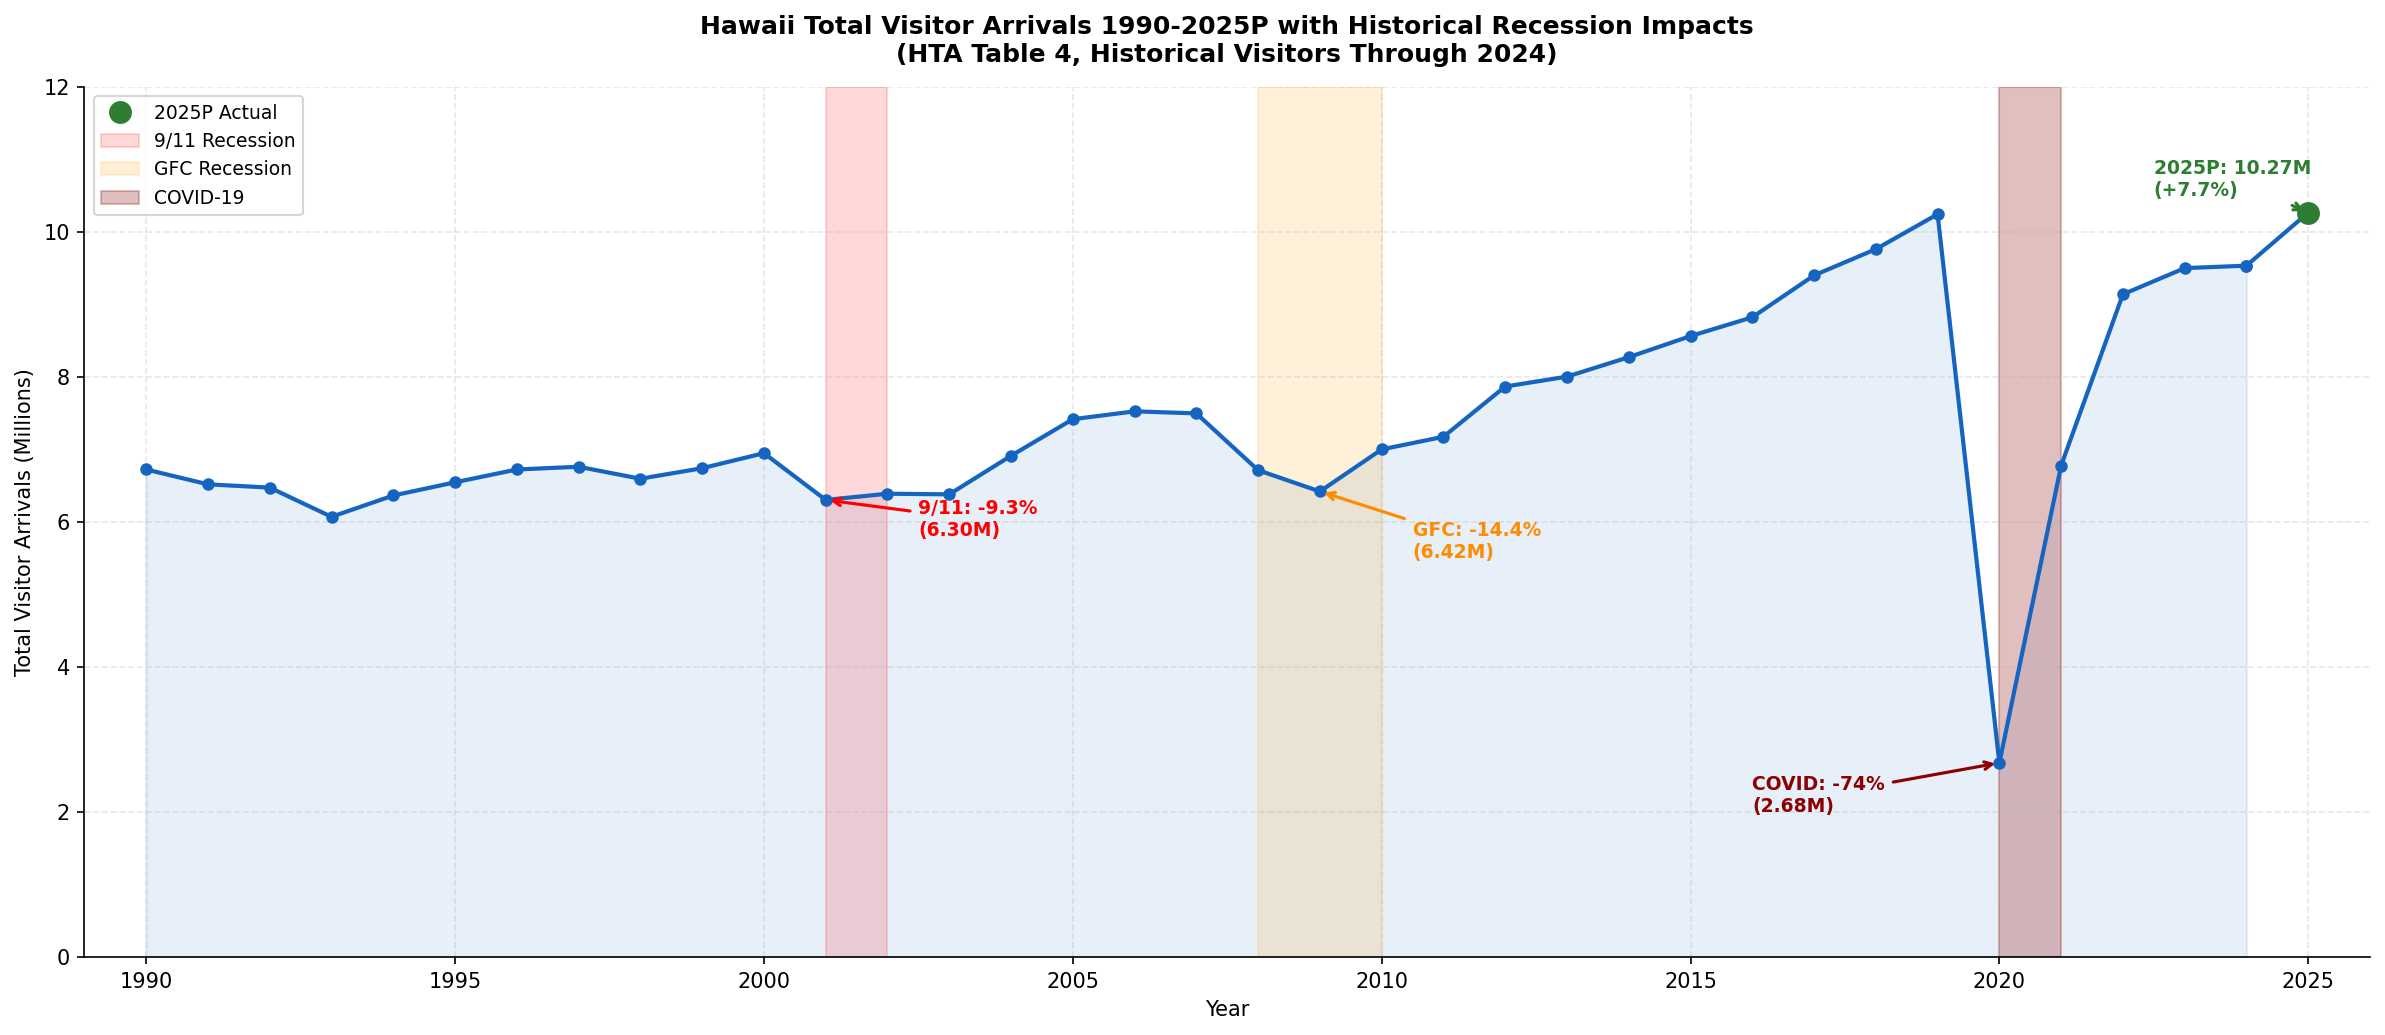
Hawaii's visitor market has demonstrated remarkable recovery resilience. From the COVID-19 trough of 2.7 million visitors in 2020 (a 73.9% collapse from the 2019 peak of 10.4 million), the market recovered to 9.53 million in 2024 — representing 97.5% of the pre-pandemic peak. The 2025 full-year total reached approximately 10.27 million visitors, effectively surpassing the 2019 peak for the first time.
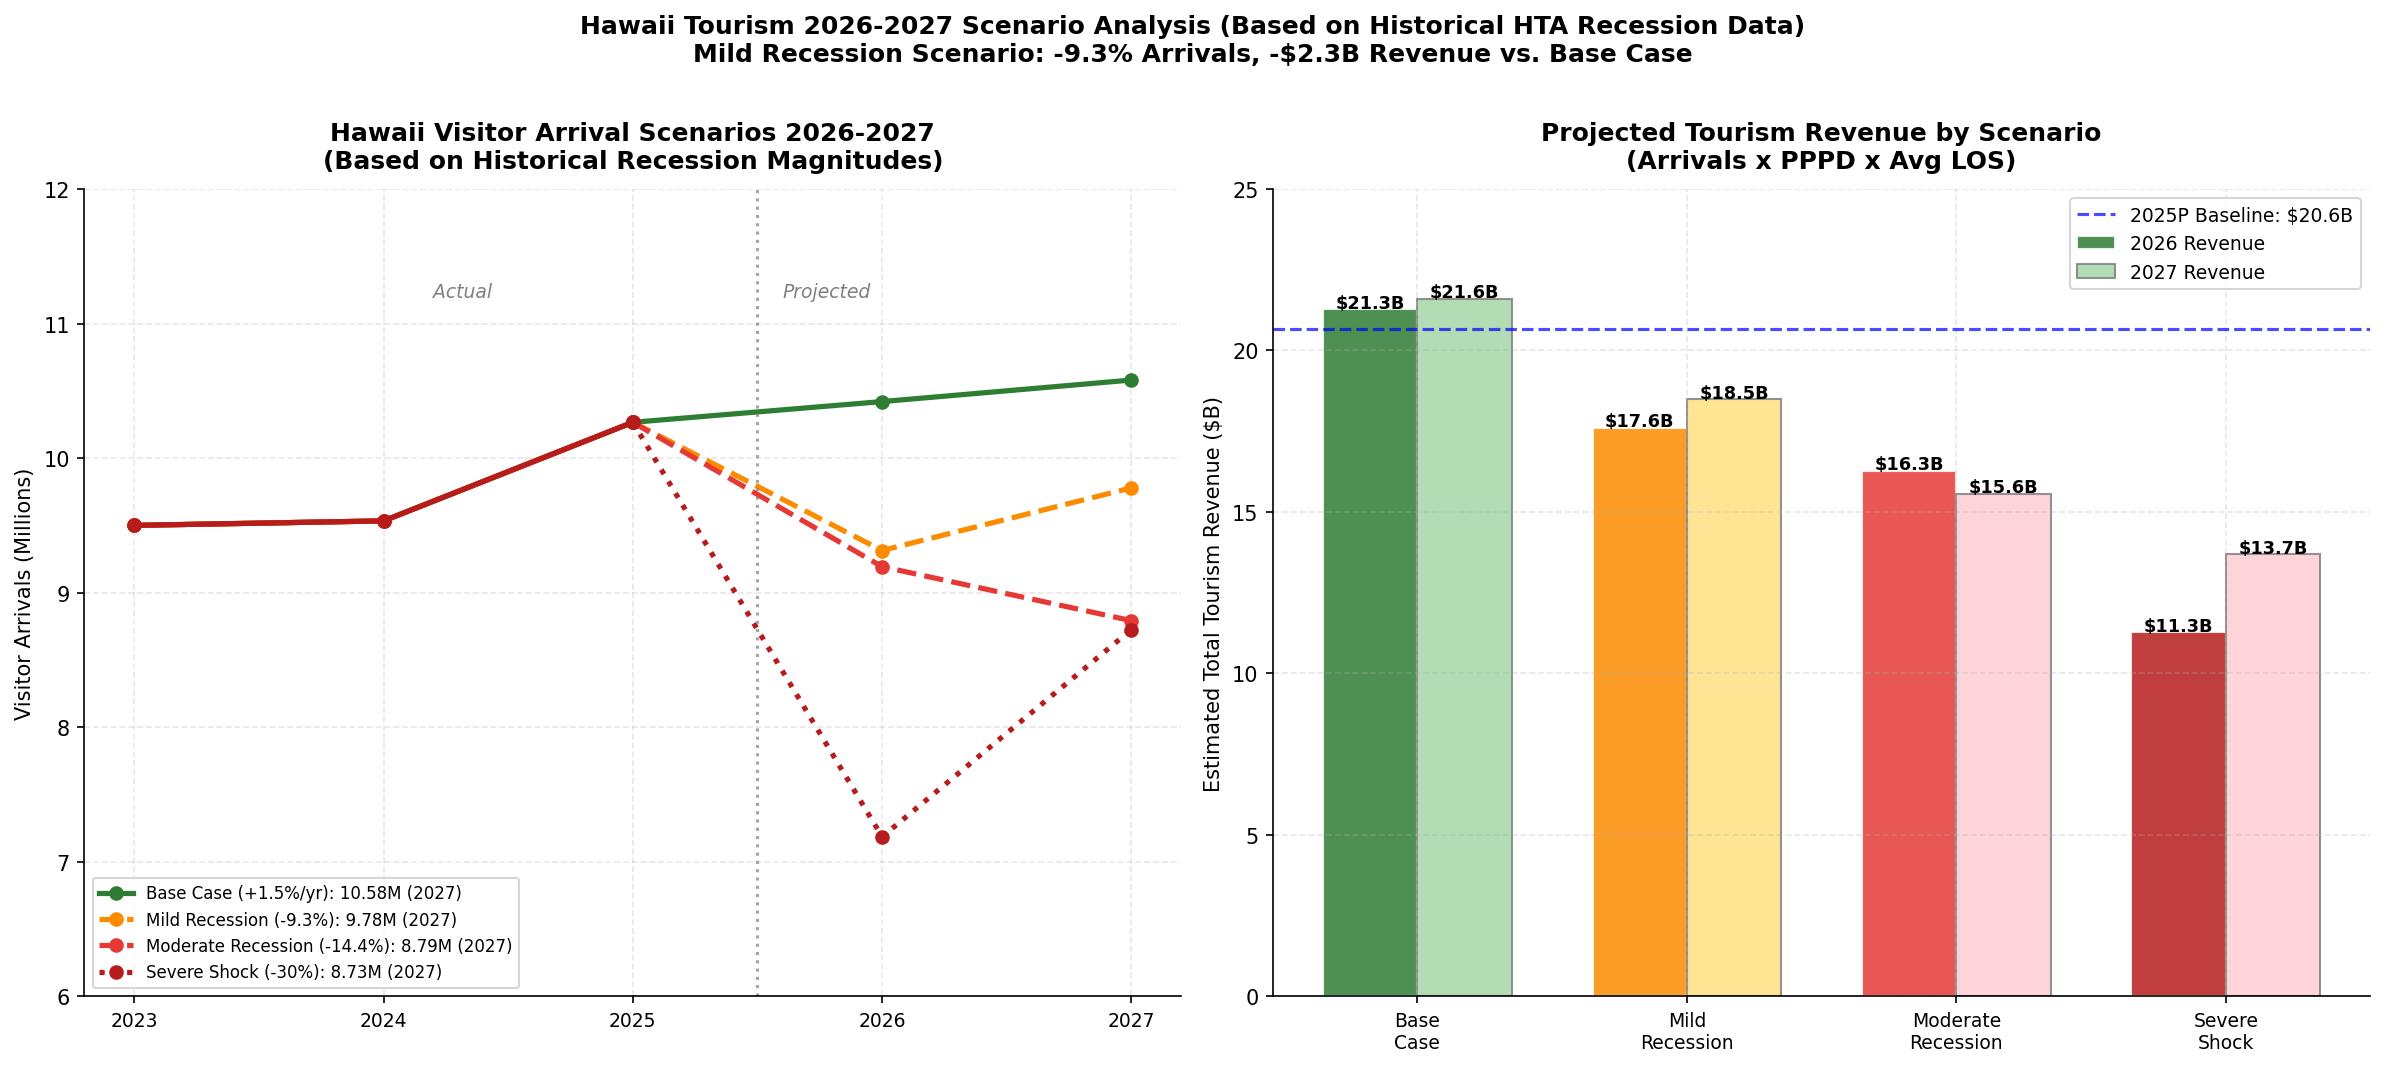
The long-run historical record (1989–2024) reveals that Hawaii has experienced three major demand shocks: the 9/11 attacks (2001, -9.3%), the Global Financial Crisis (2008–2009, -14.4% cumulative), and COVID-19 (2020, -73.9%). In each prior case, recovery to pre-shock levels required approximately 3 years. This historical pattern is central to the forward-looking scenario analysis in Path 7.
Origin Market Performance
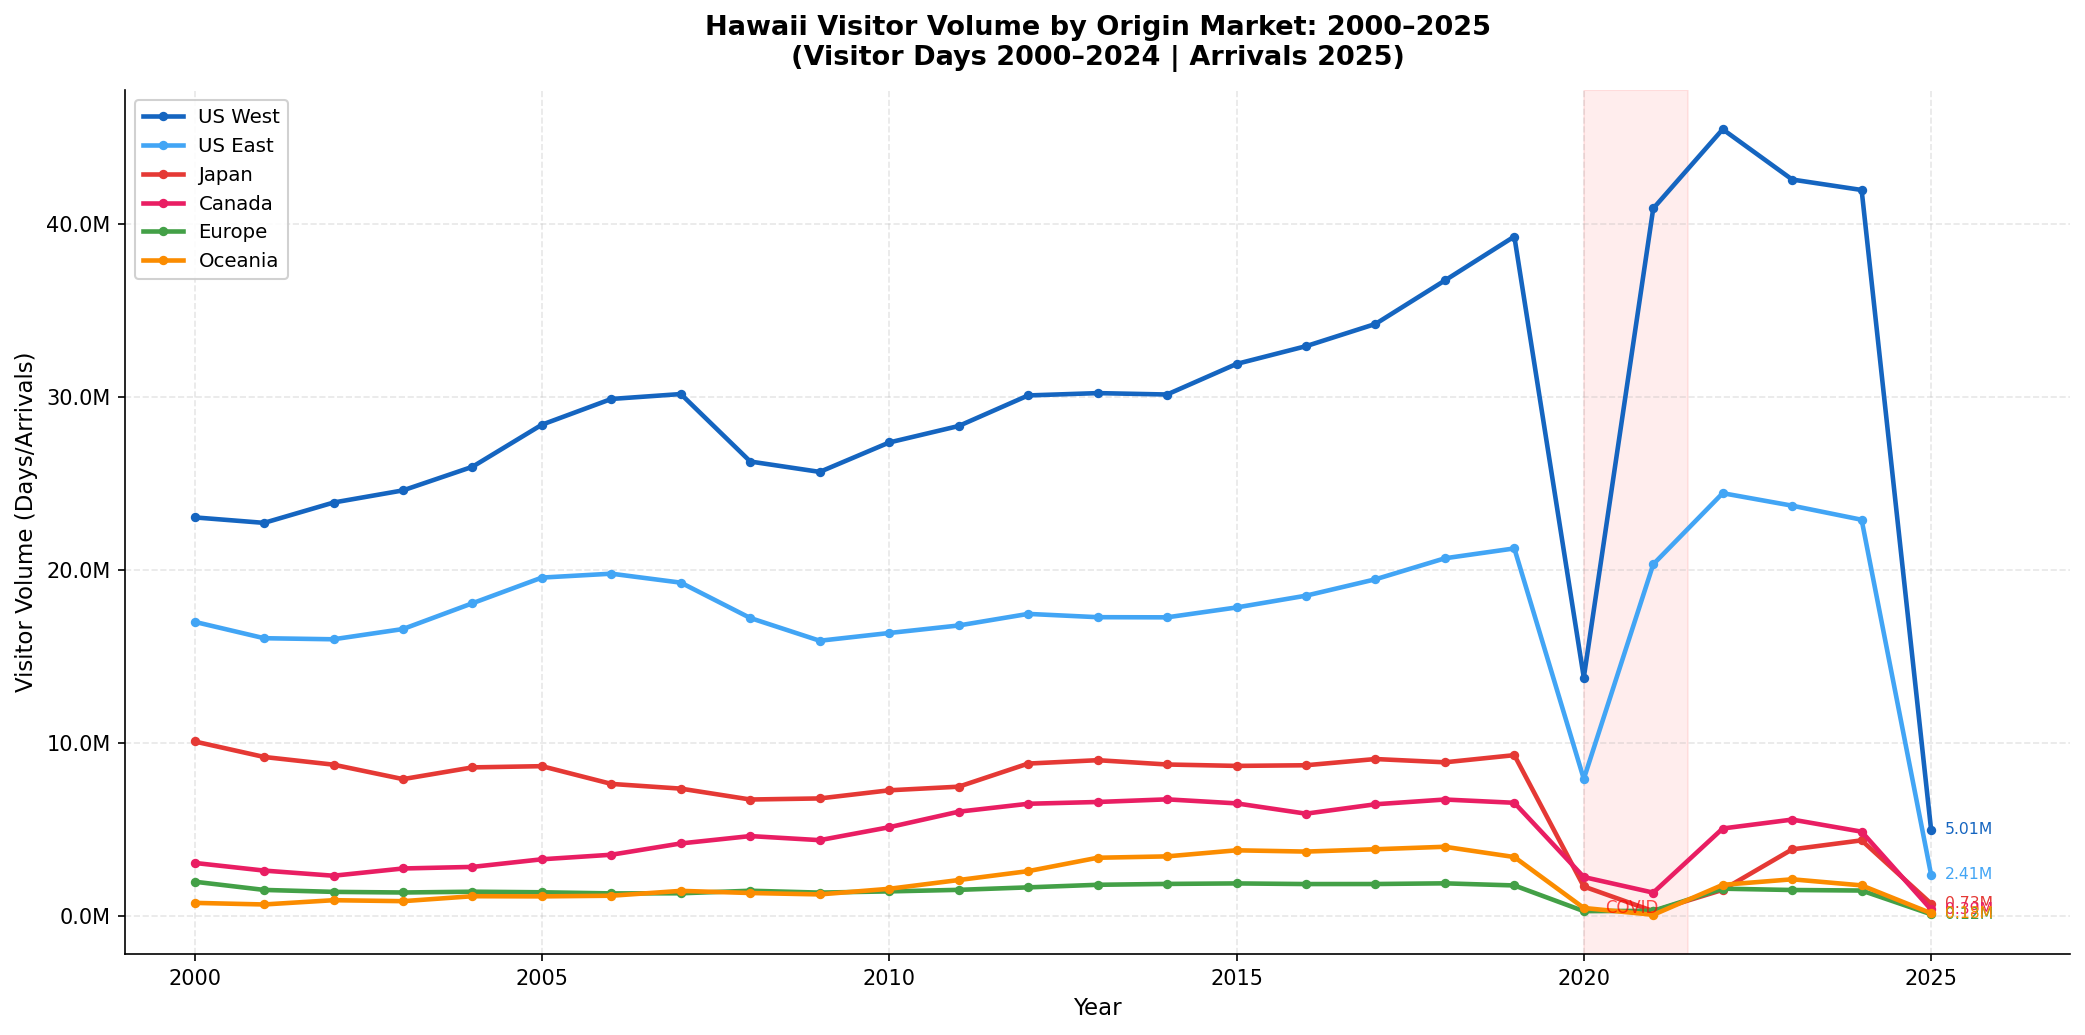
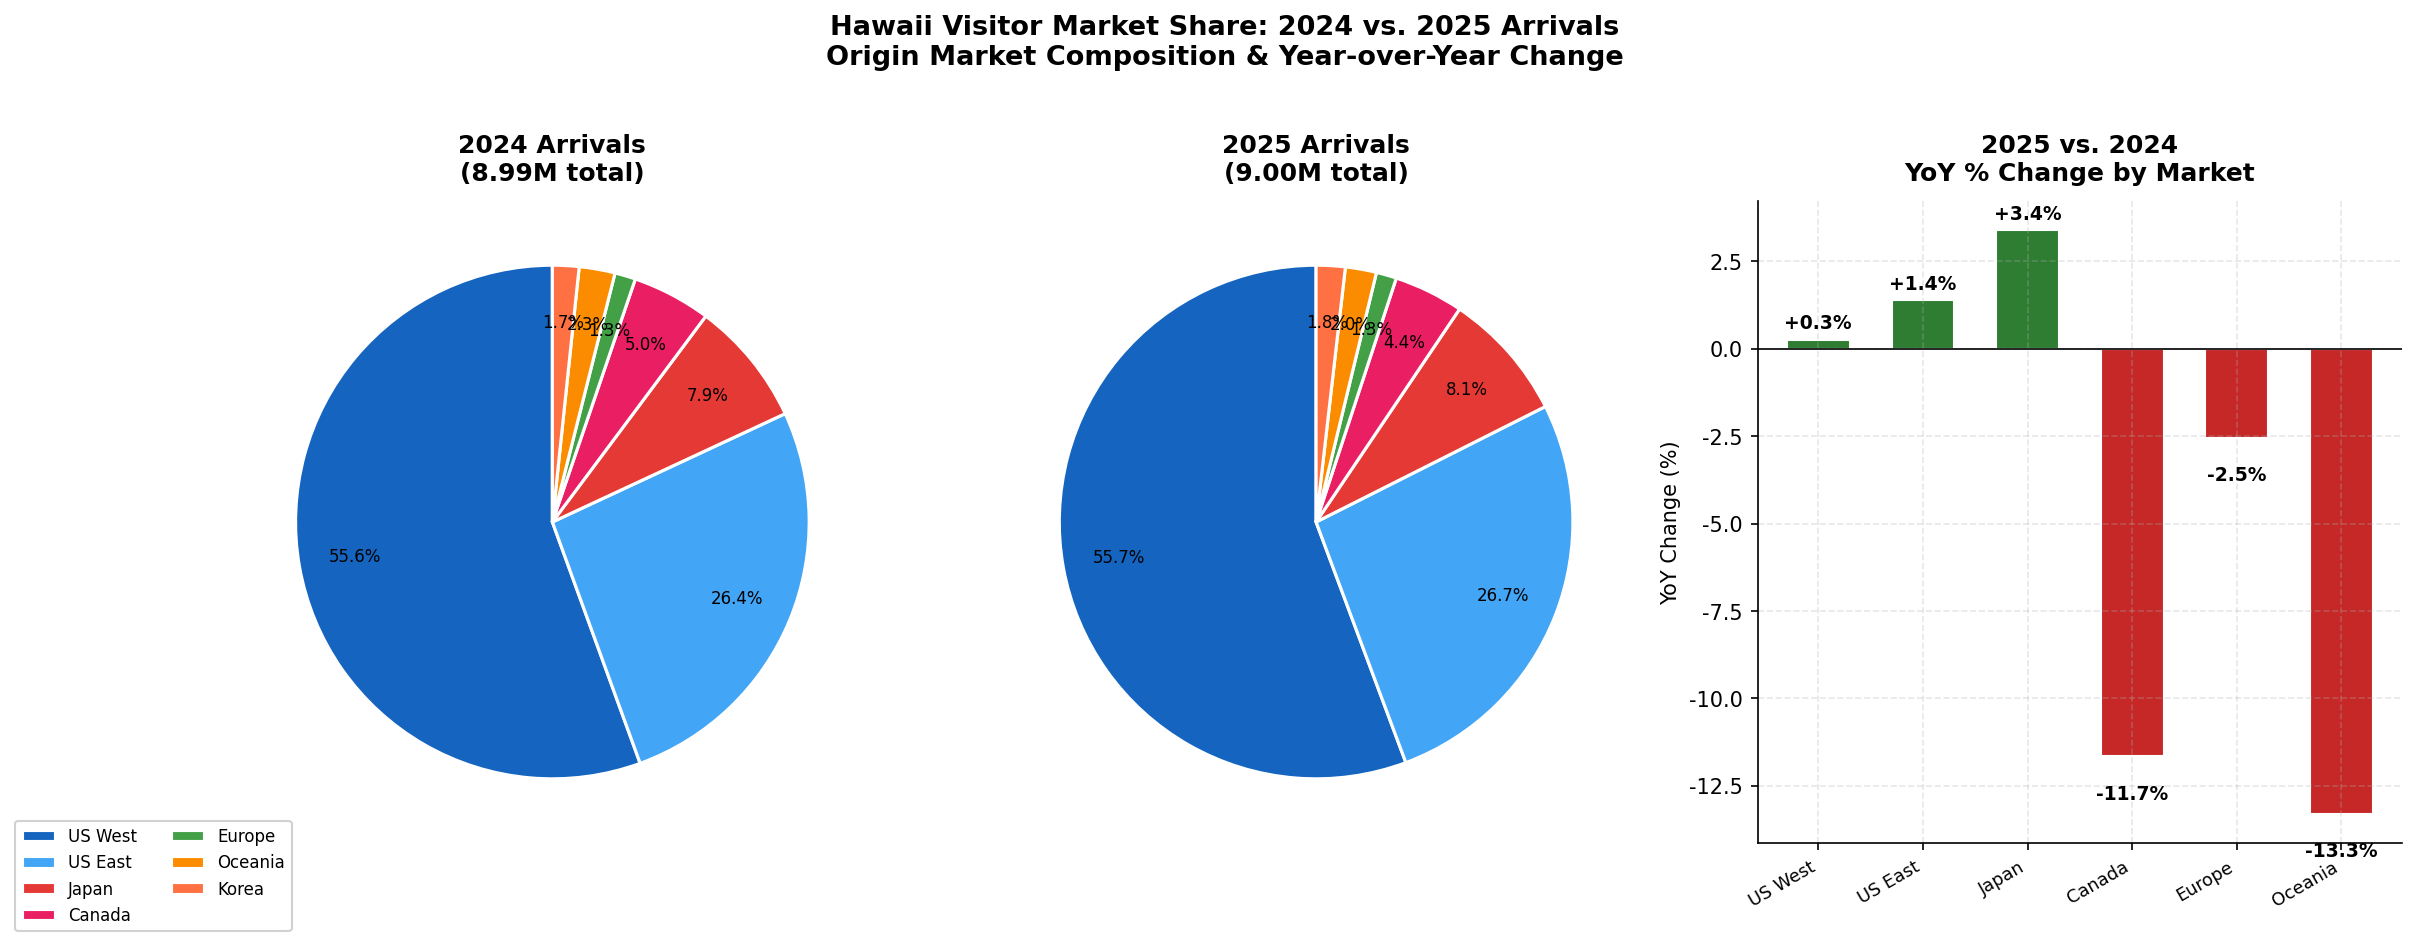
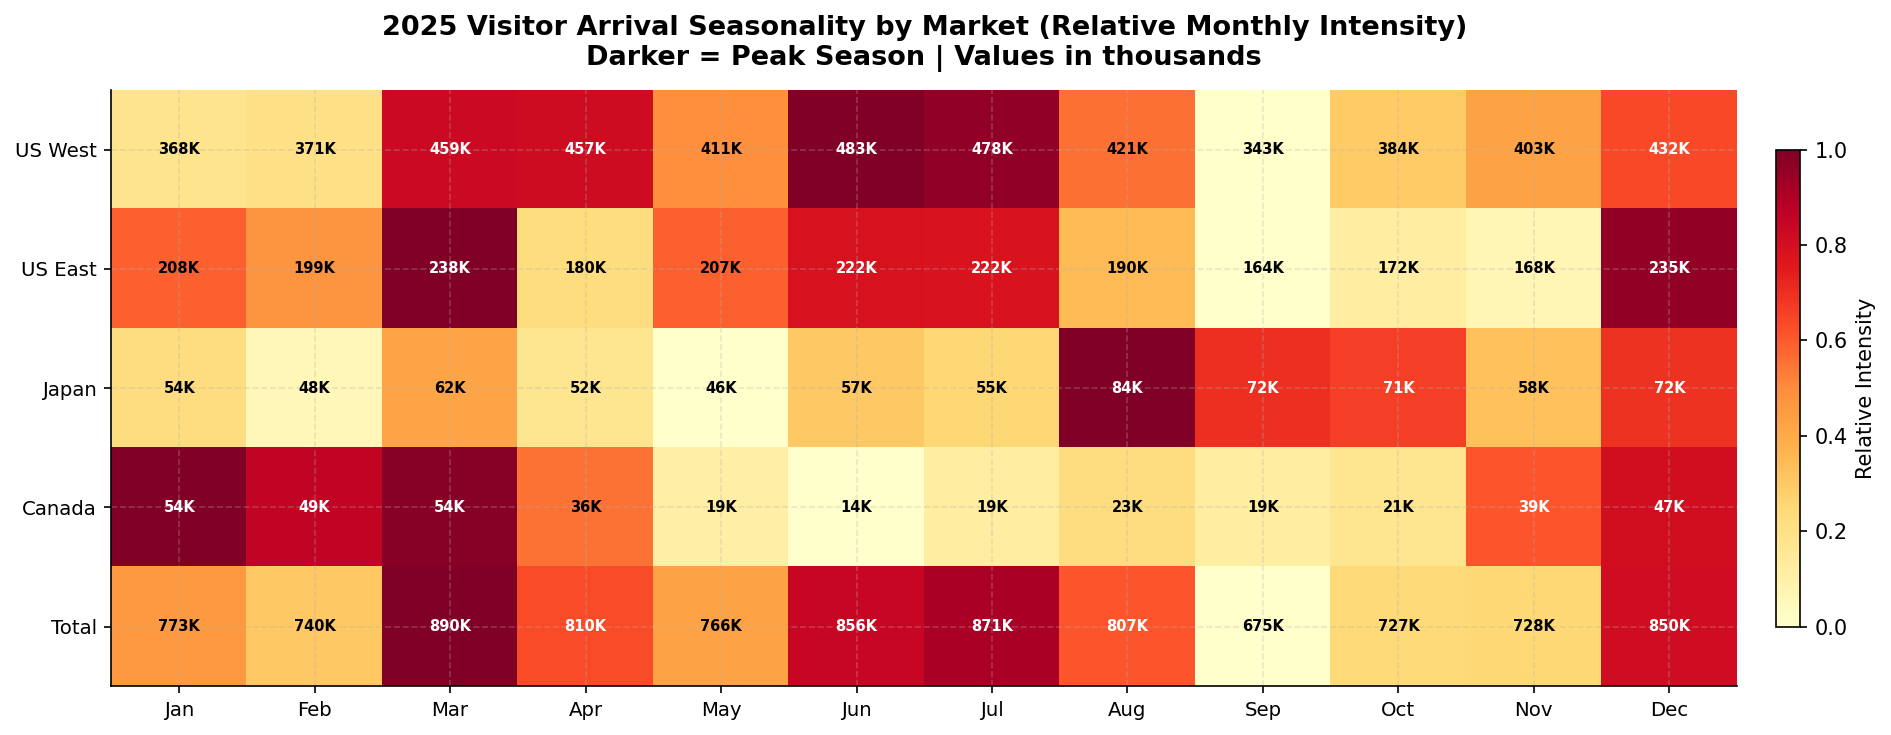
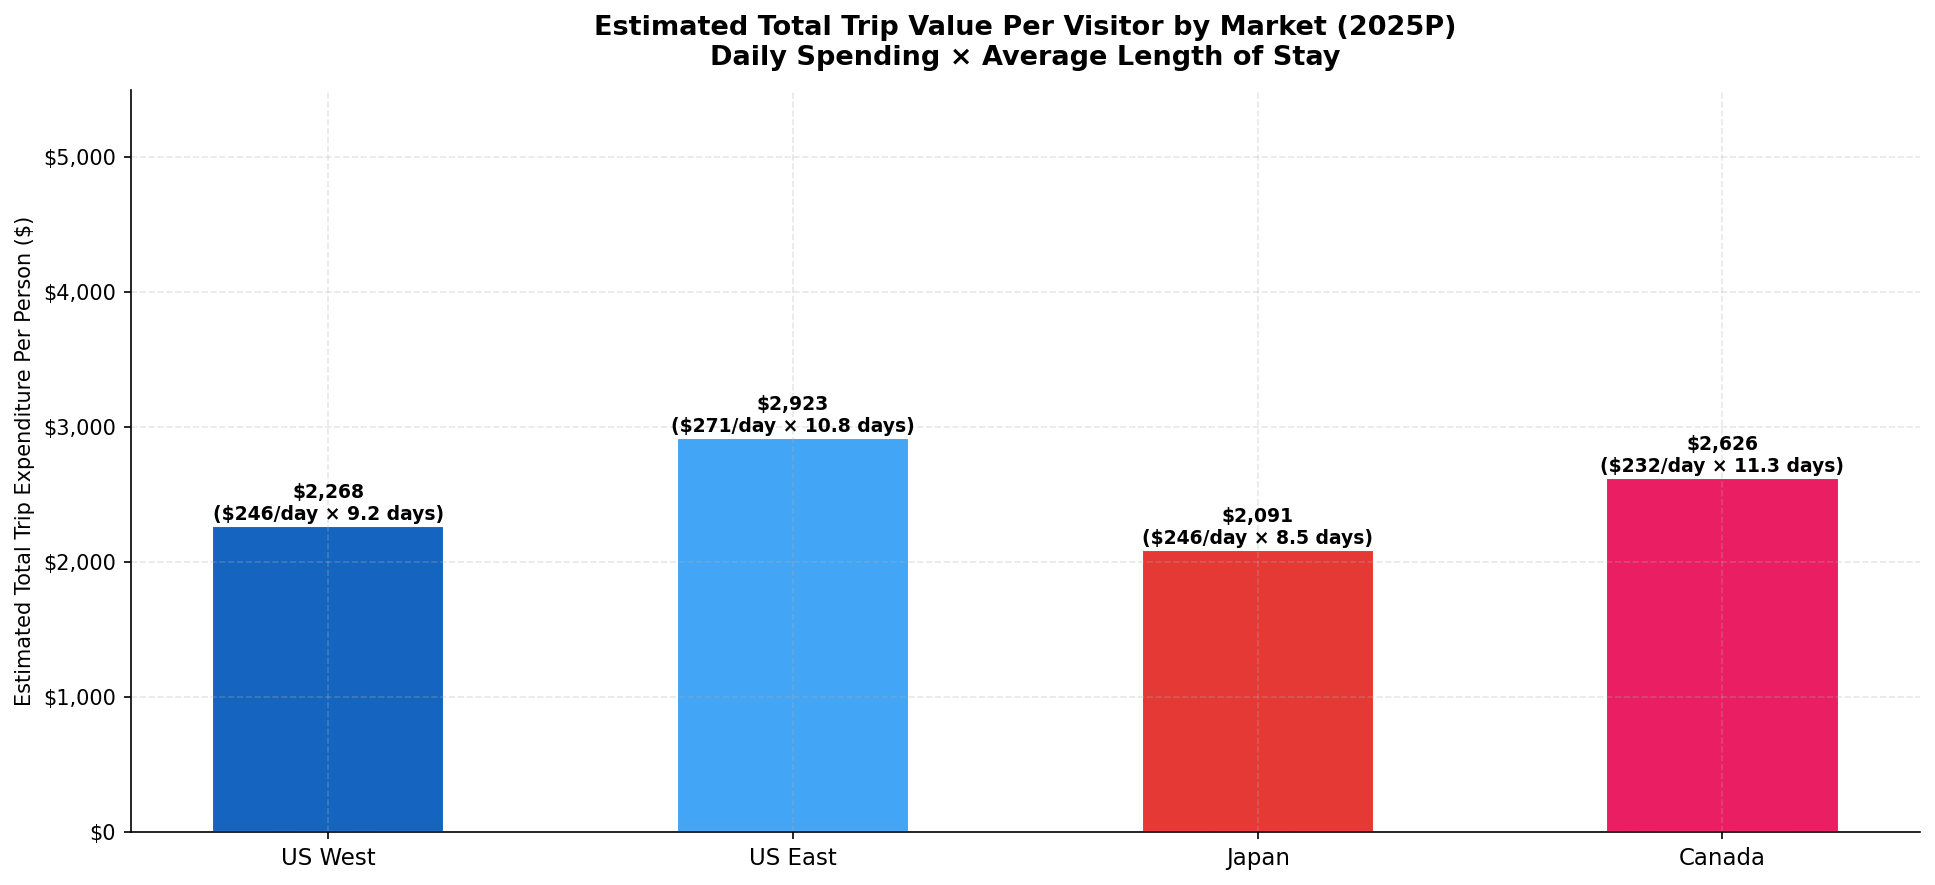
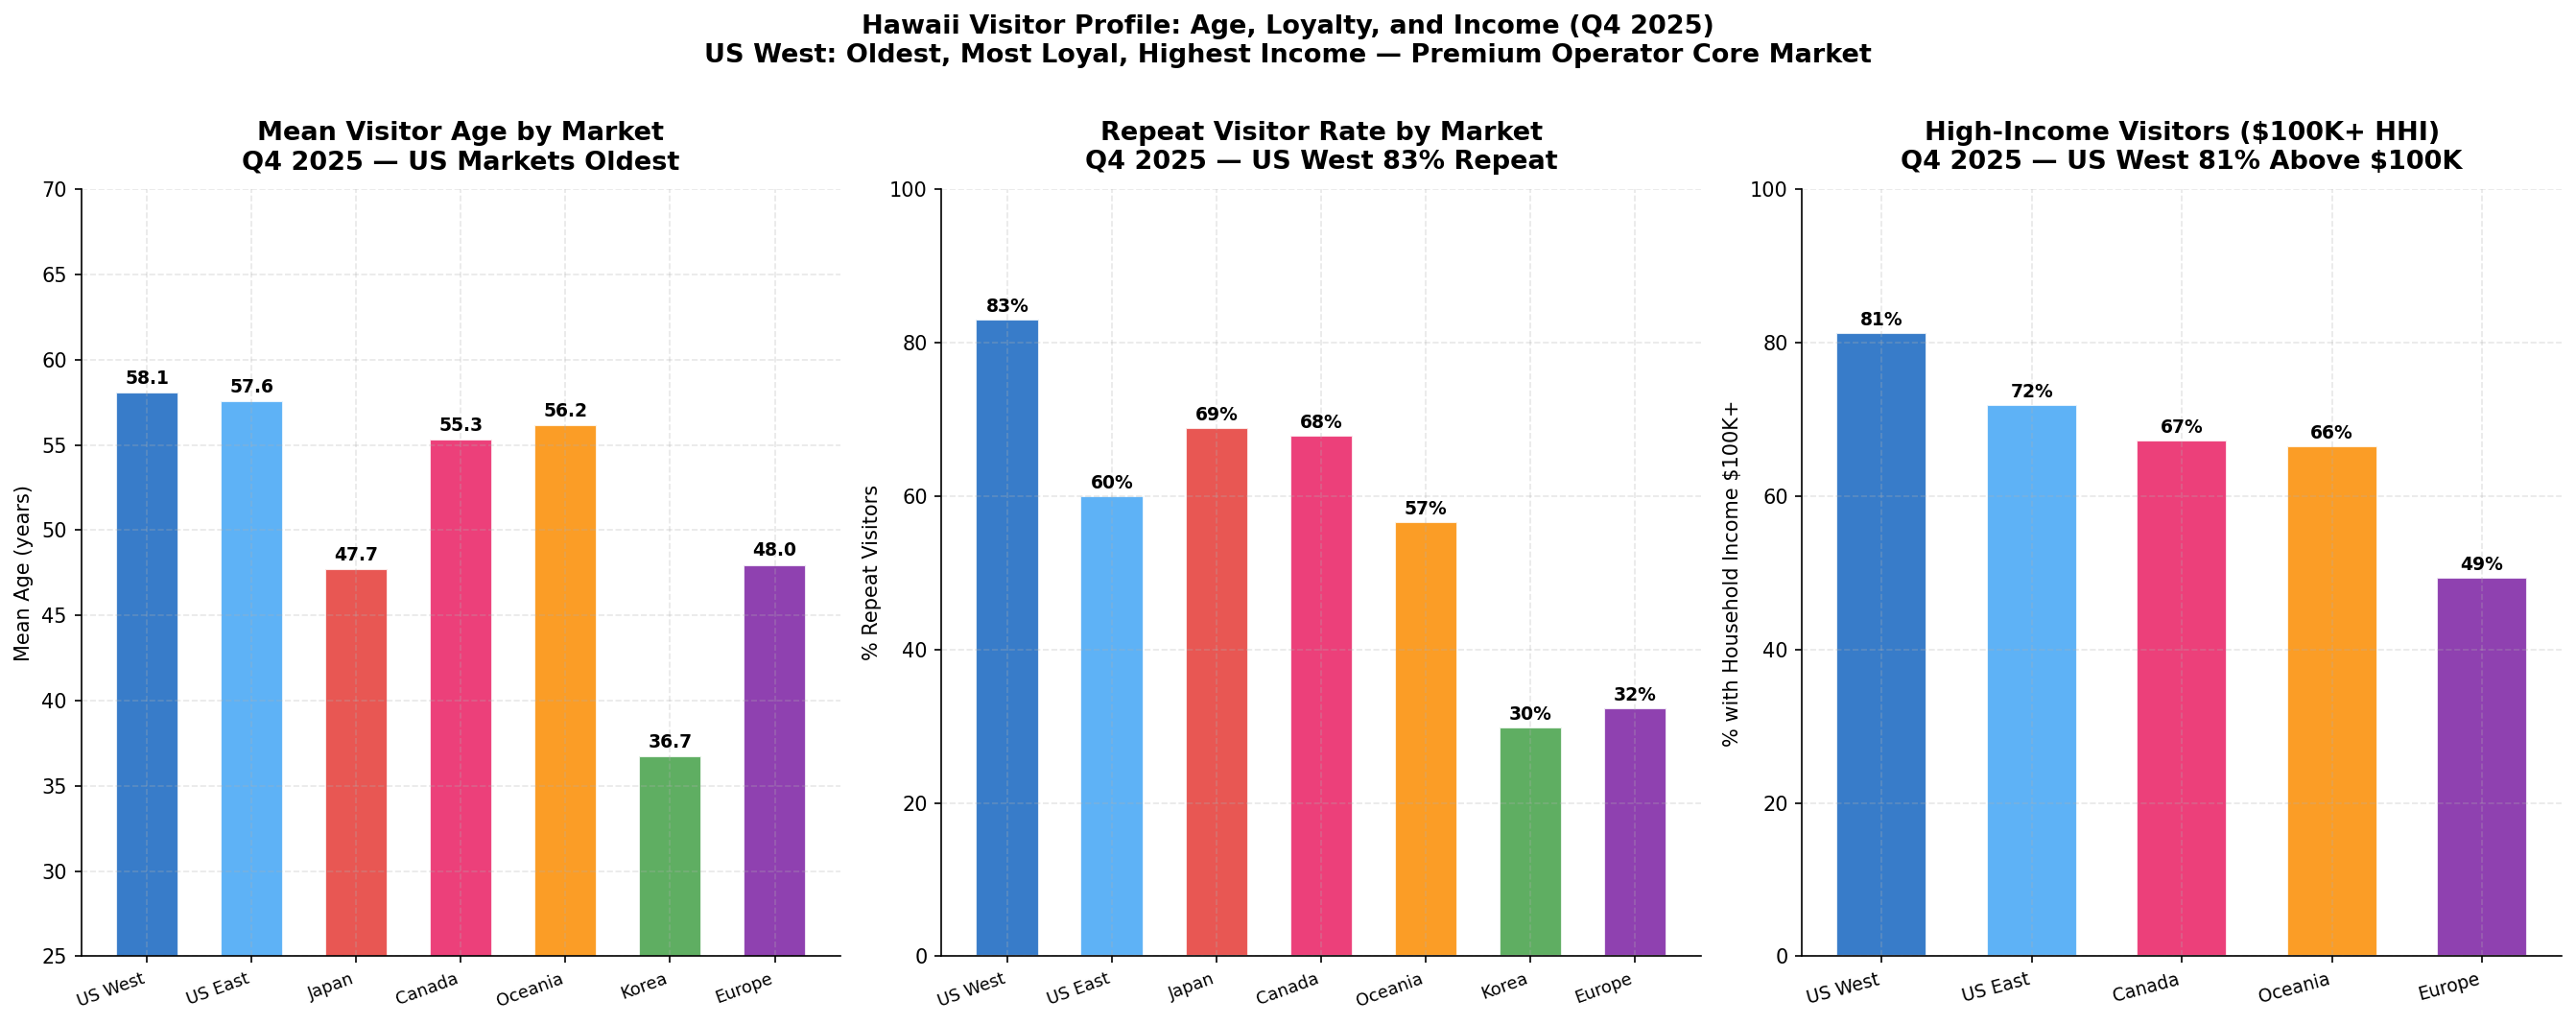
The US domestic market dominates Hawaii's visitor base, with US West (primarily California, Washington, Oregon) accounting for approximately 38% of all arrivals and US East contributing a further 22%. Japan, historically Hawaii's most important international market, has recovered to approximately 1.1 million visitors in 2025 — still below its 2019 level of 1.58 million, representing the single largest recovery gap in the market.
Island Distribution
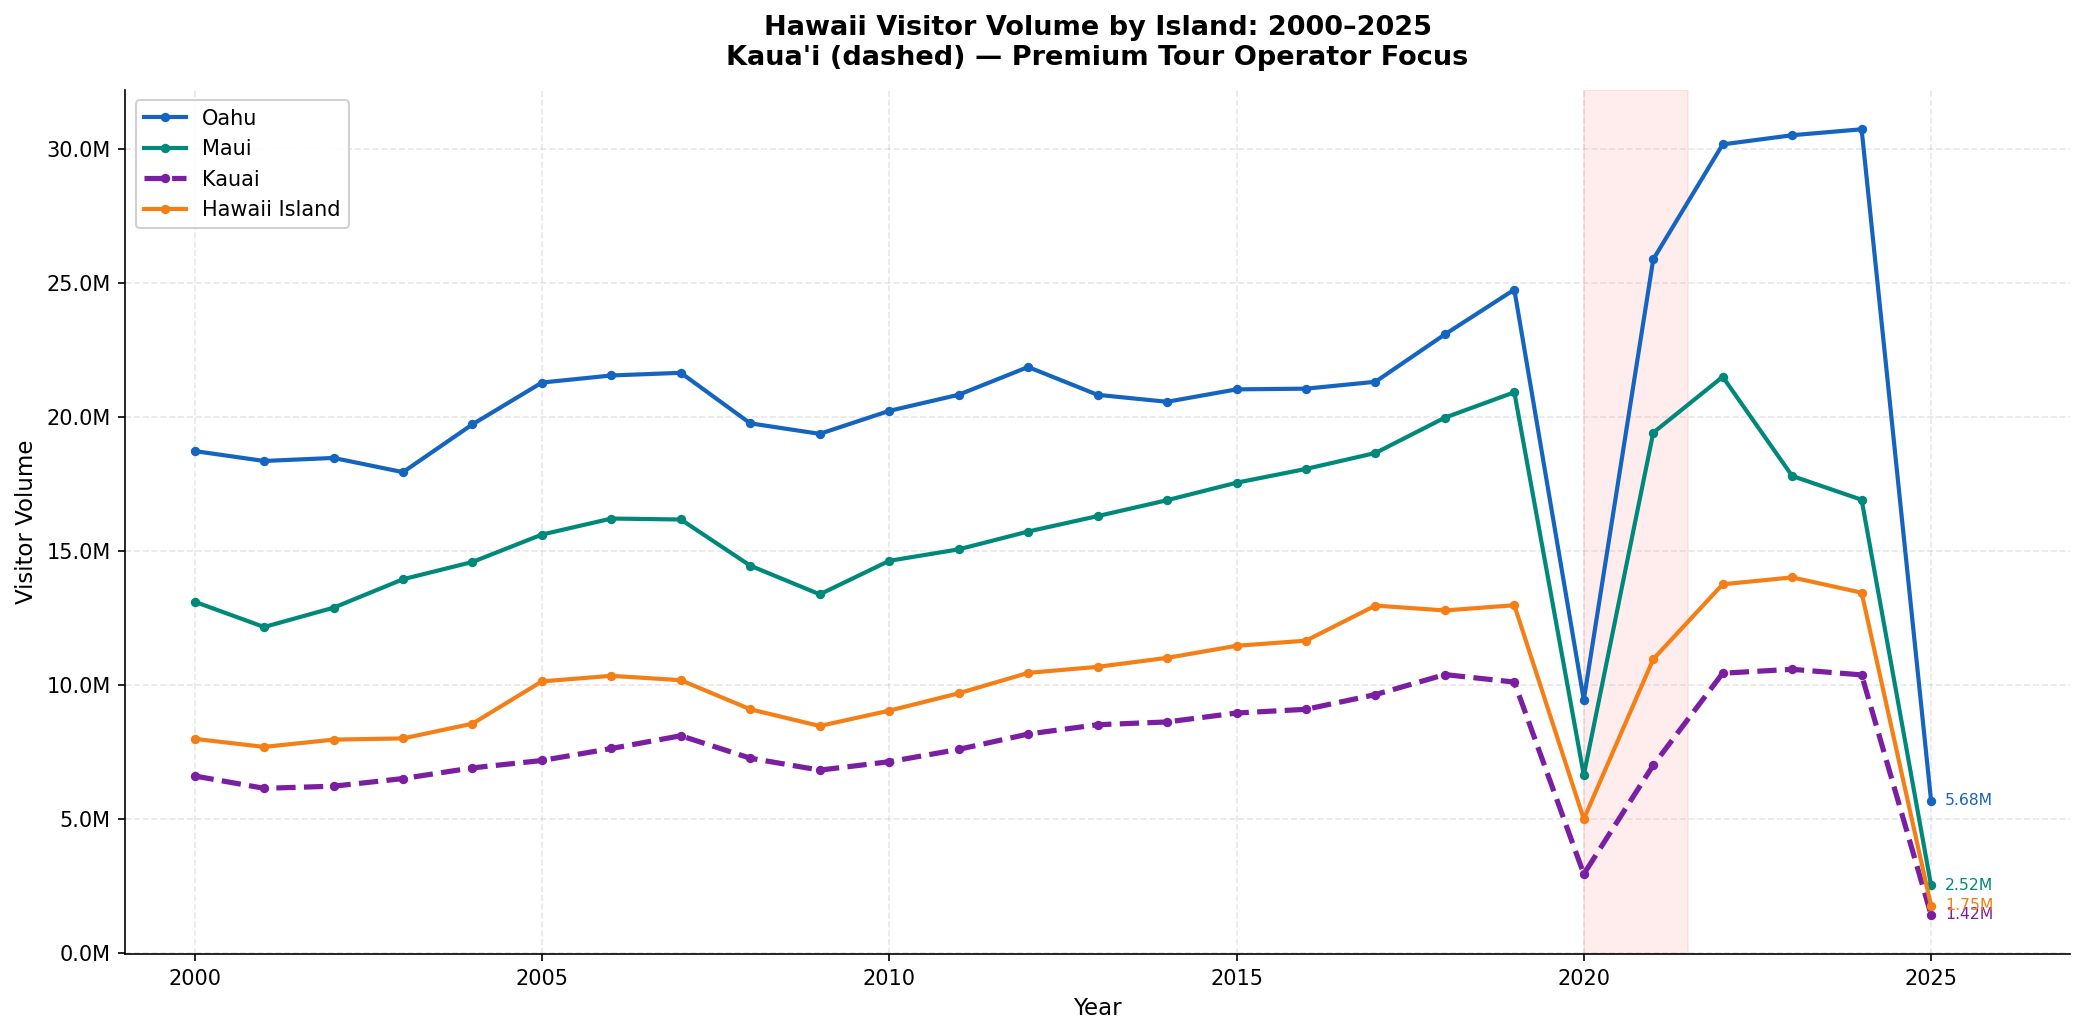
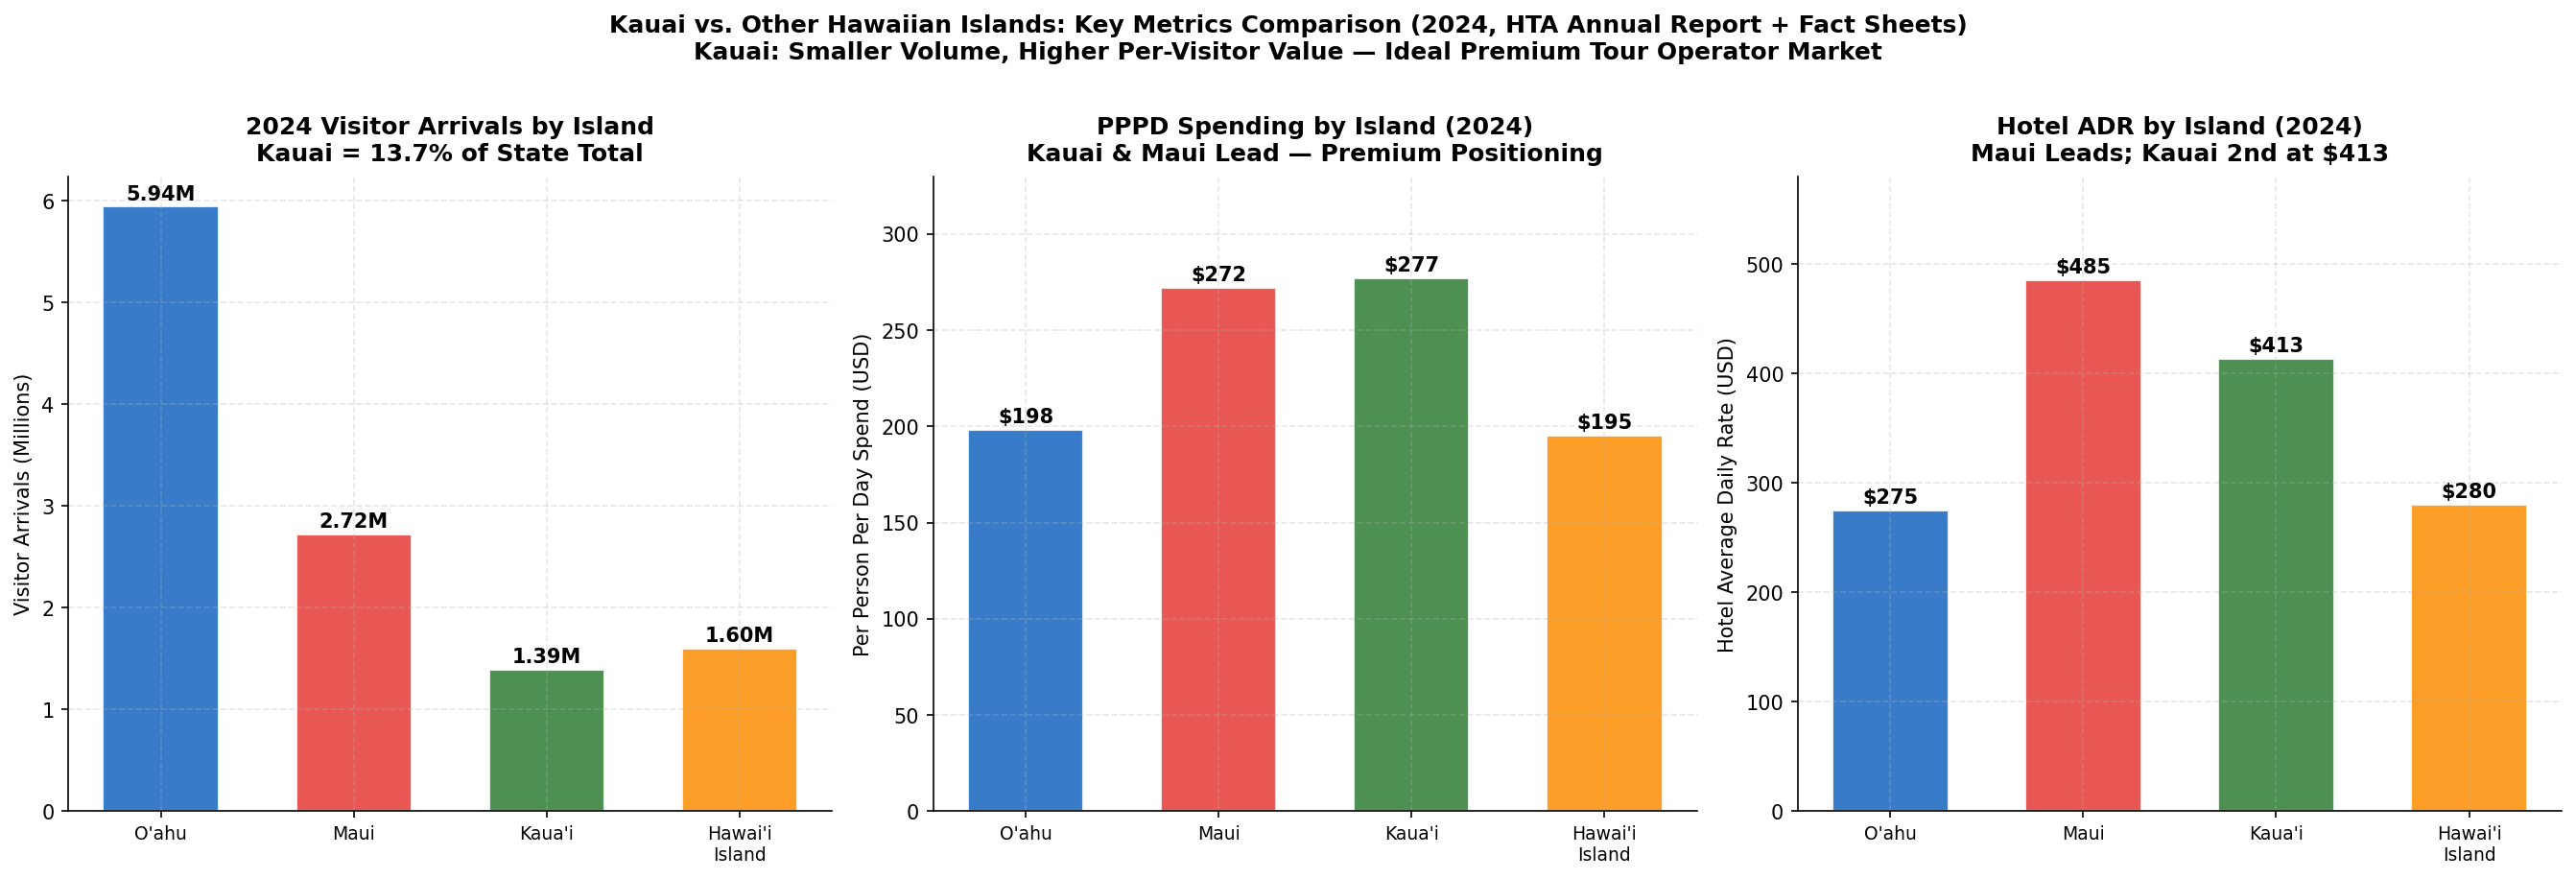
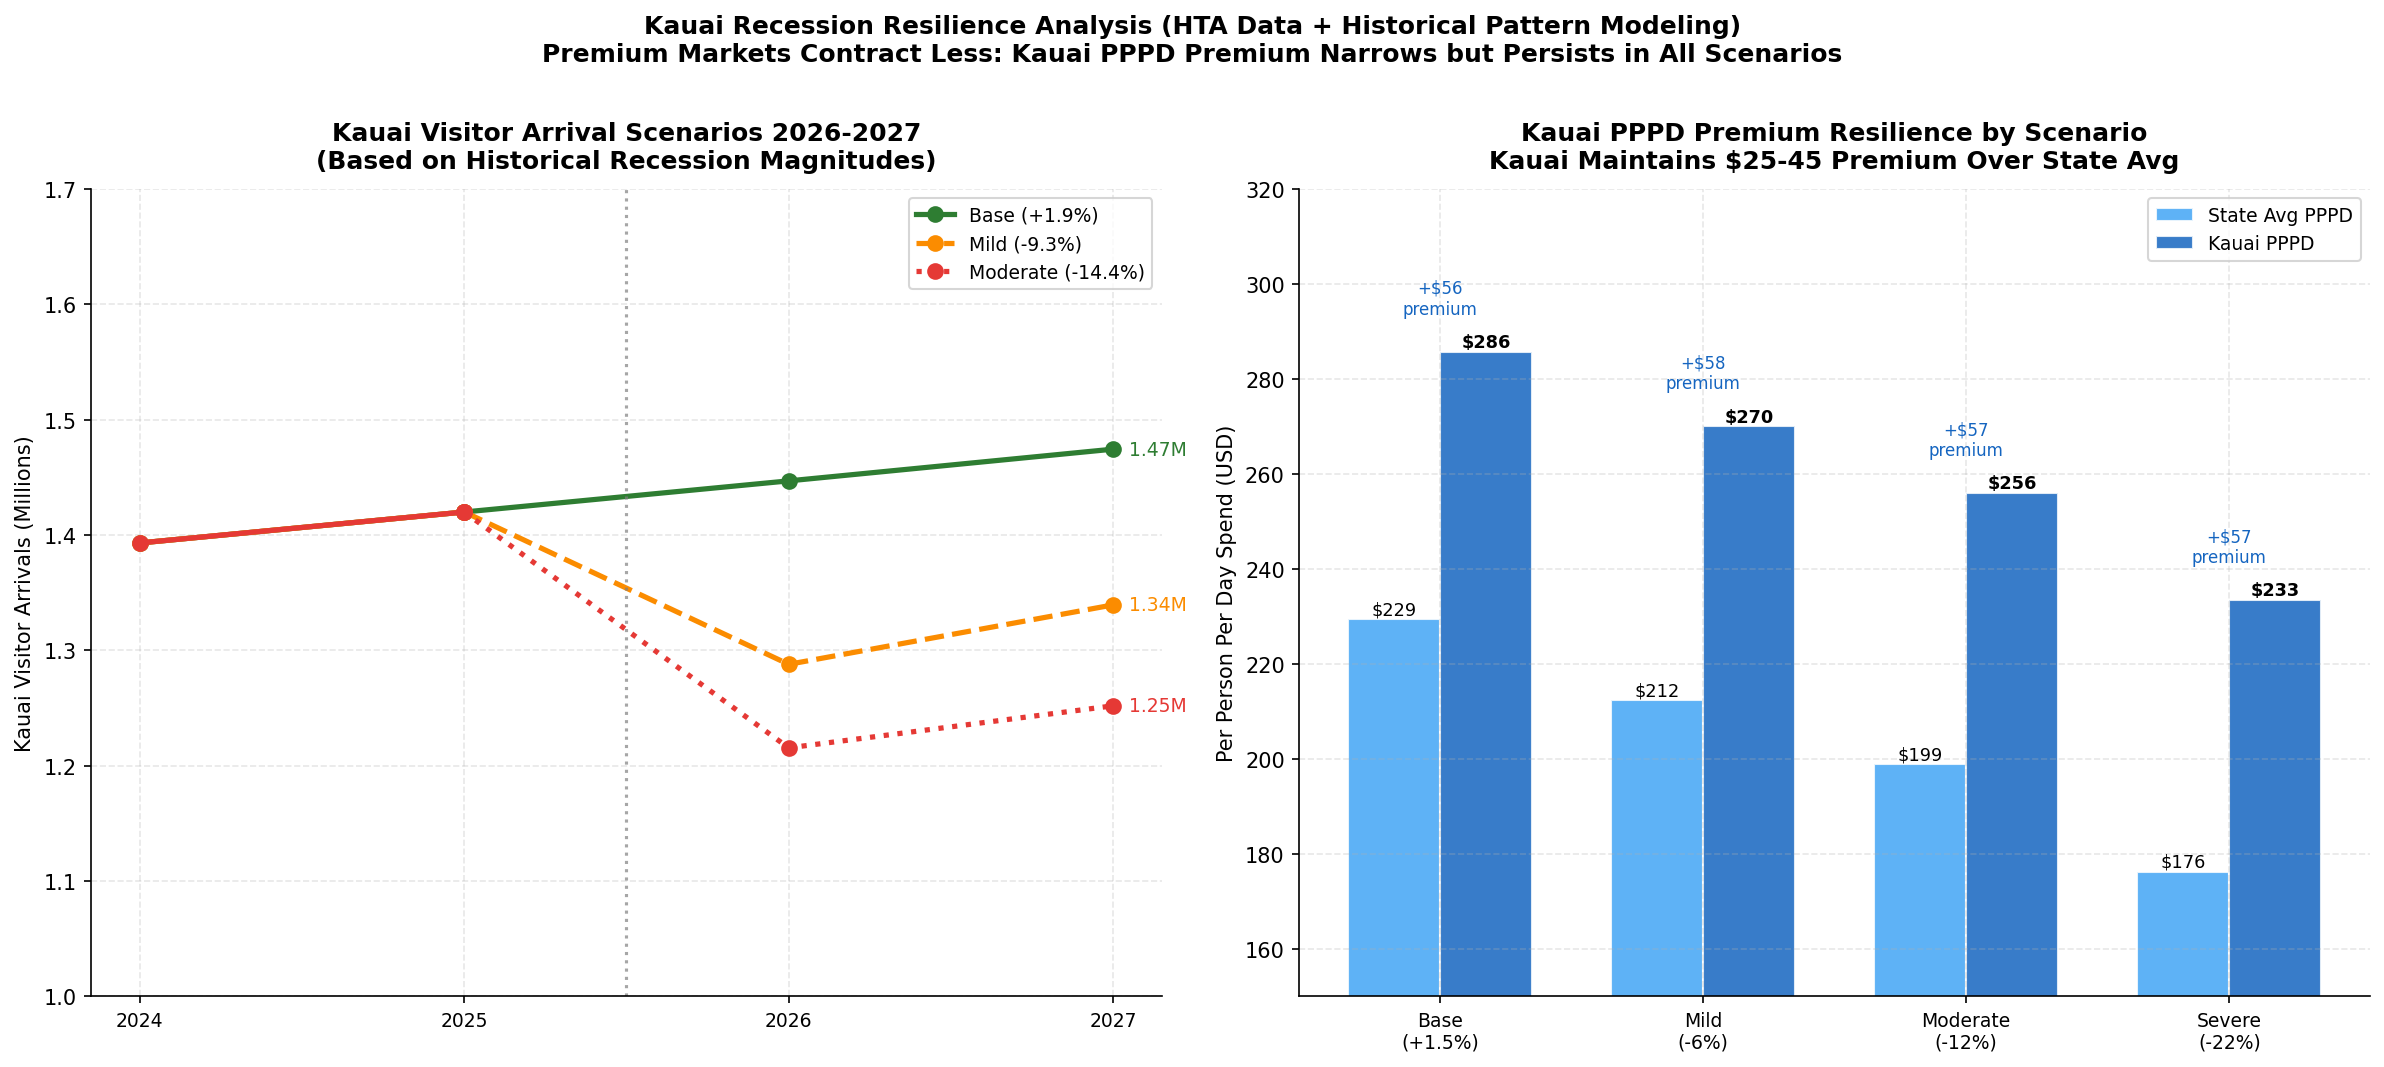
O'ahu receives the largest share of visitors (~57%), followed by Maui (~29%), Hawai'i Island (~22%), and Kaua'i (~14%). Note that multi-island visitors are counted at each island, so totals exceed 100%. Kaua'i's share has remained stable at approximately 13–15% of statewide arrivals, with its visitor profile skewing more premium than the state average.
2026 Year-to-Date
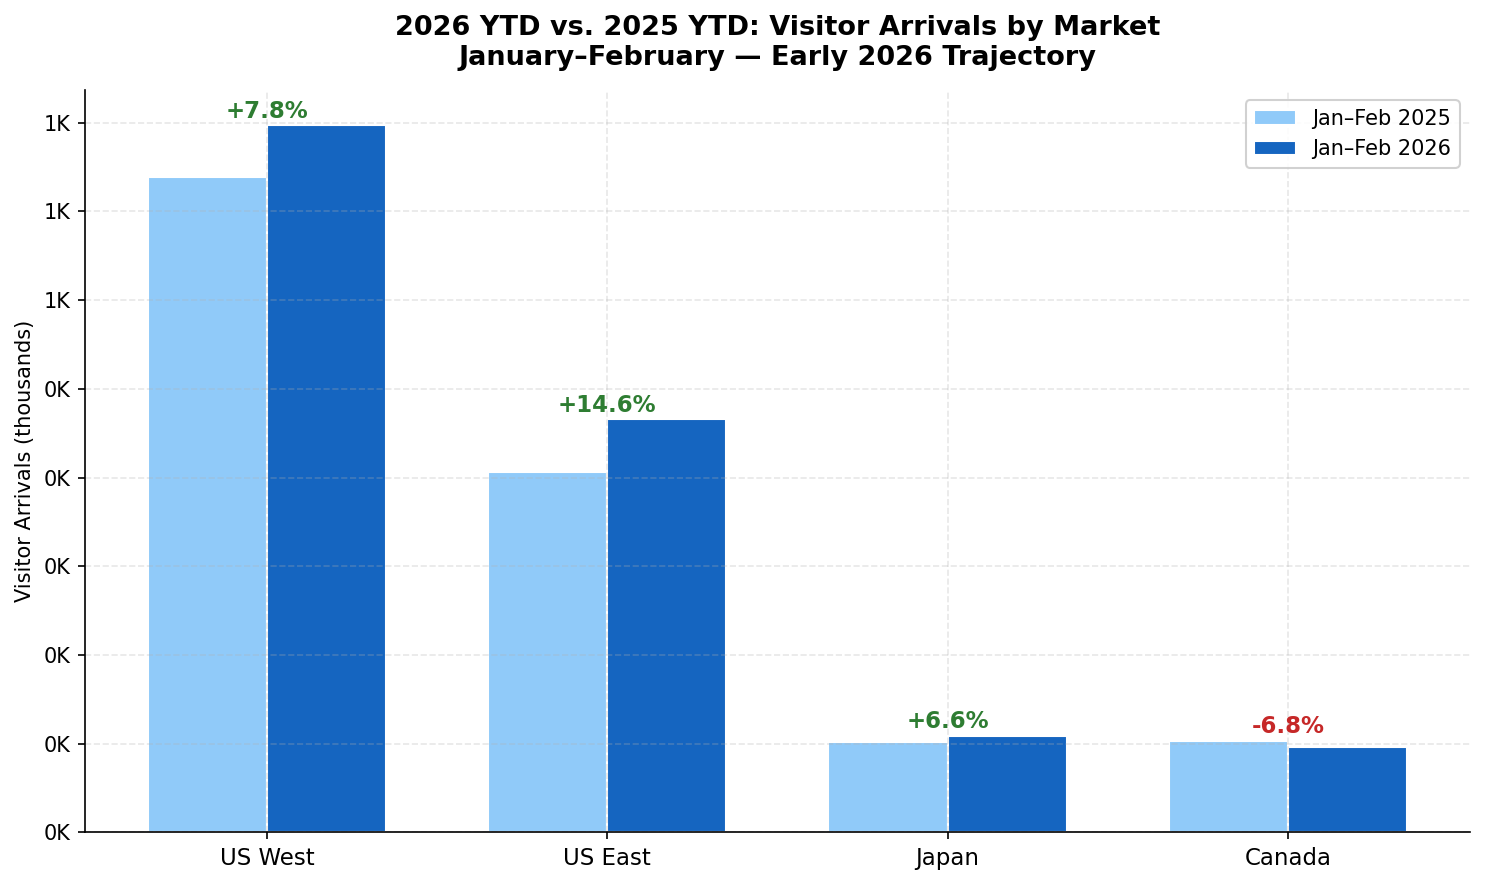
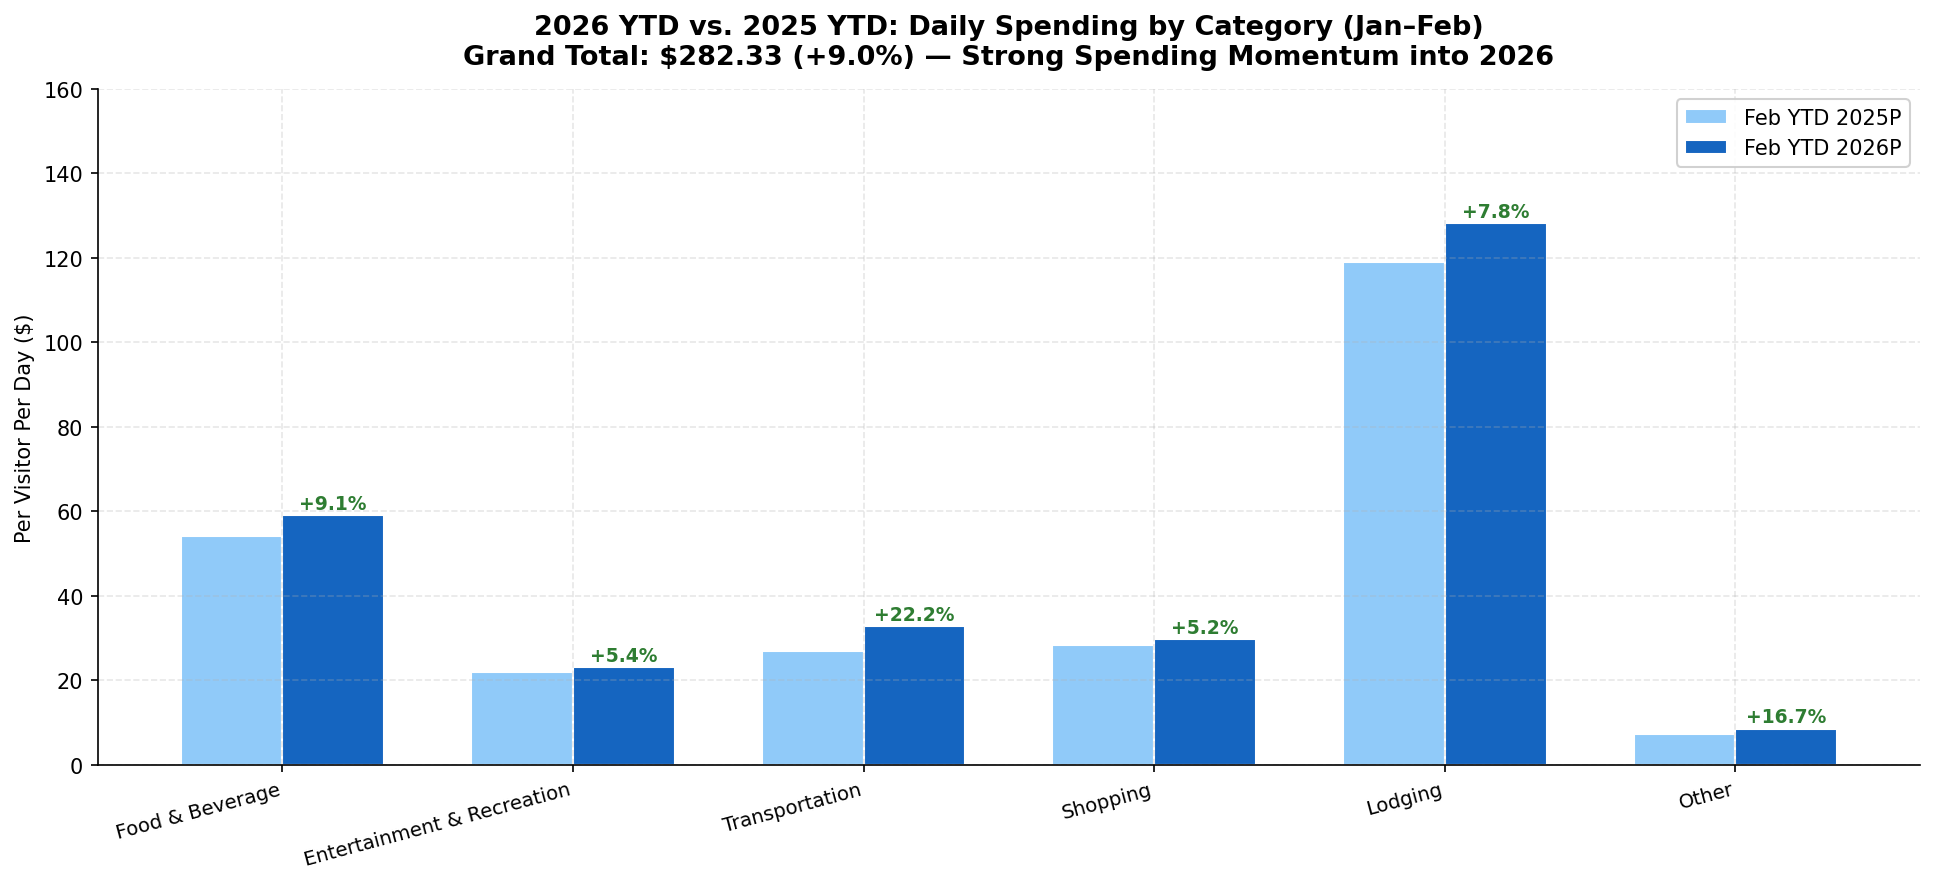
January and February 2026 arrivals totaled approximately 1.765 million, tracking +2.1% above the same period in 2025. This suggests the base case trajectory of approximately 10.4 million visitors for full-year 2026 remains intact as of the data available.
Path 2: Visitor Spending & Expenditure
Spending Overview
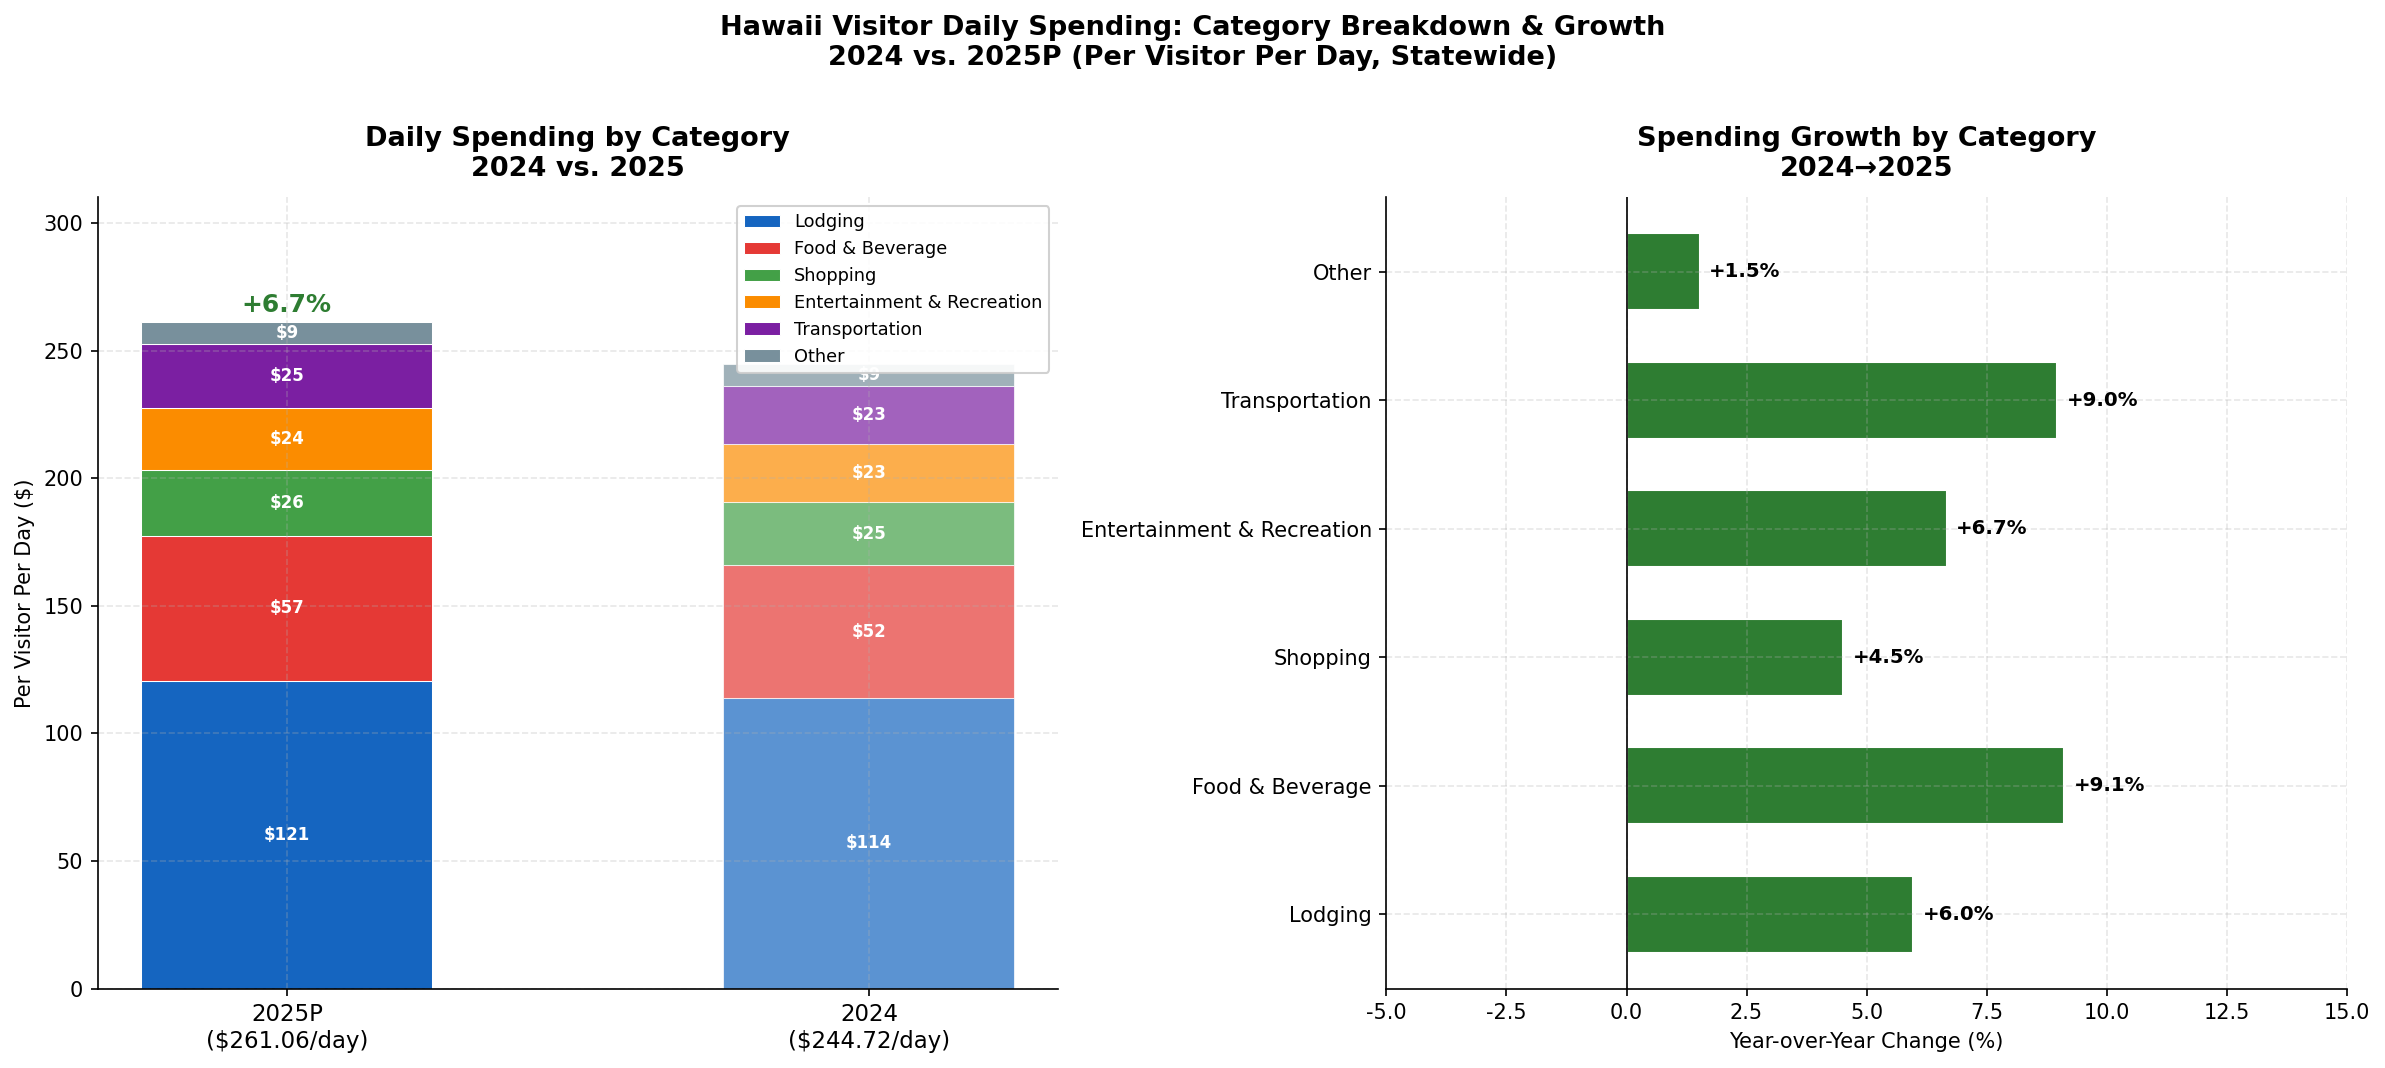
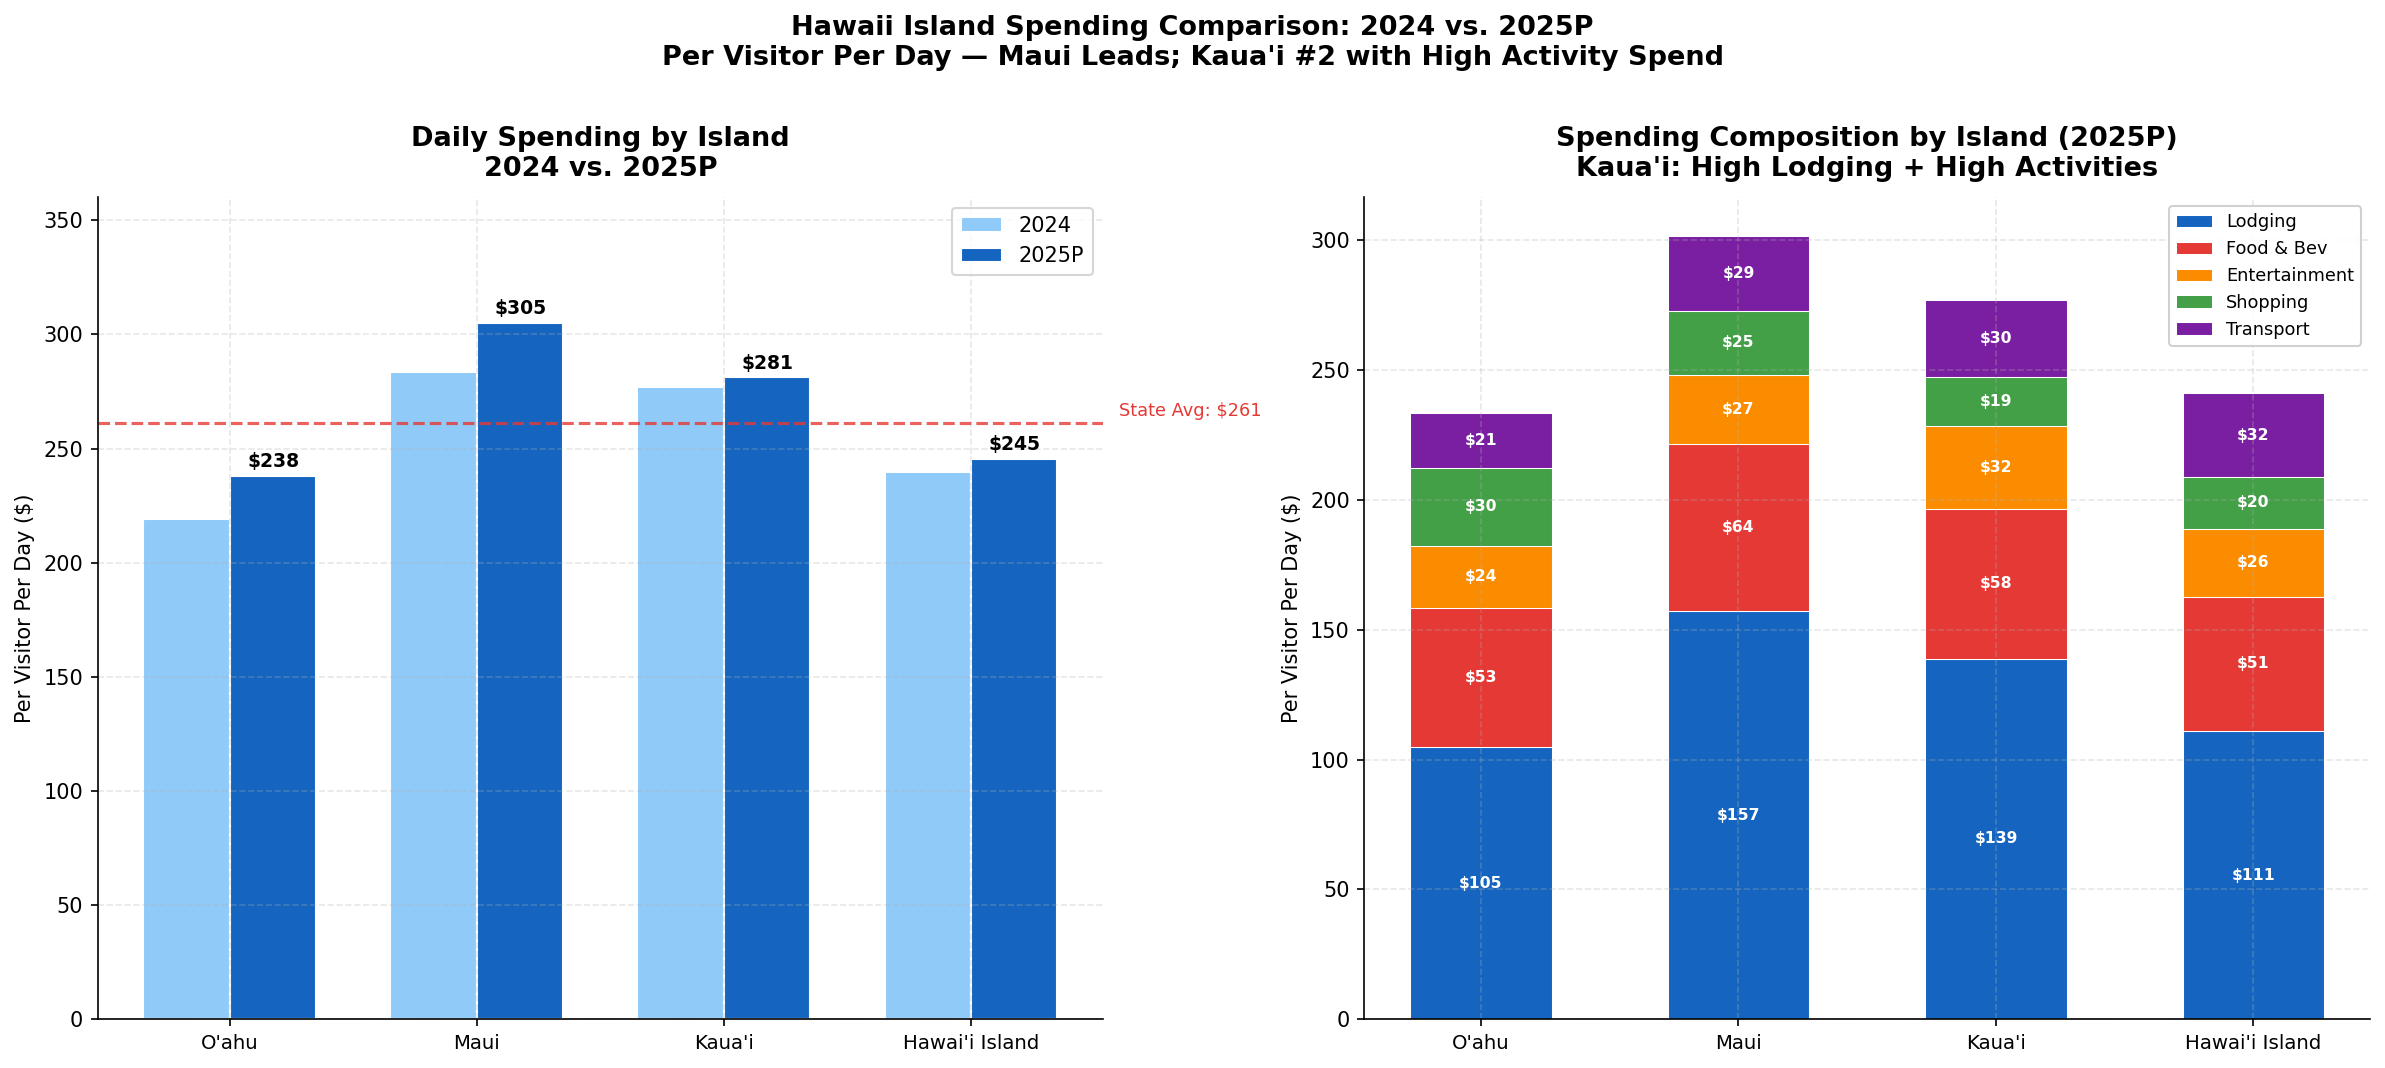
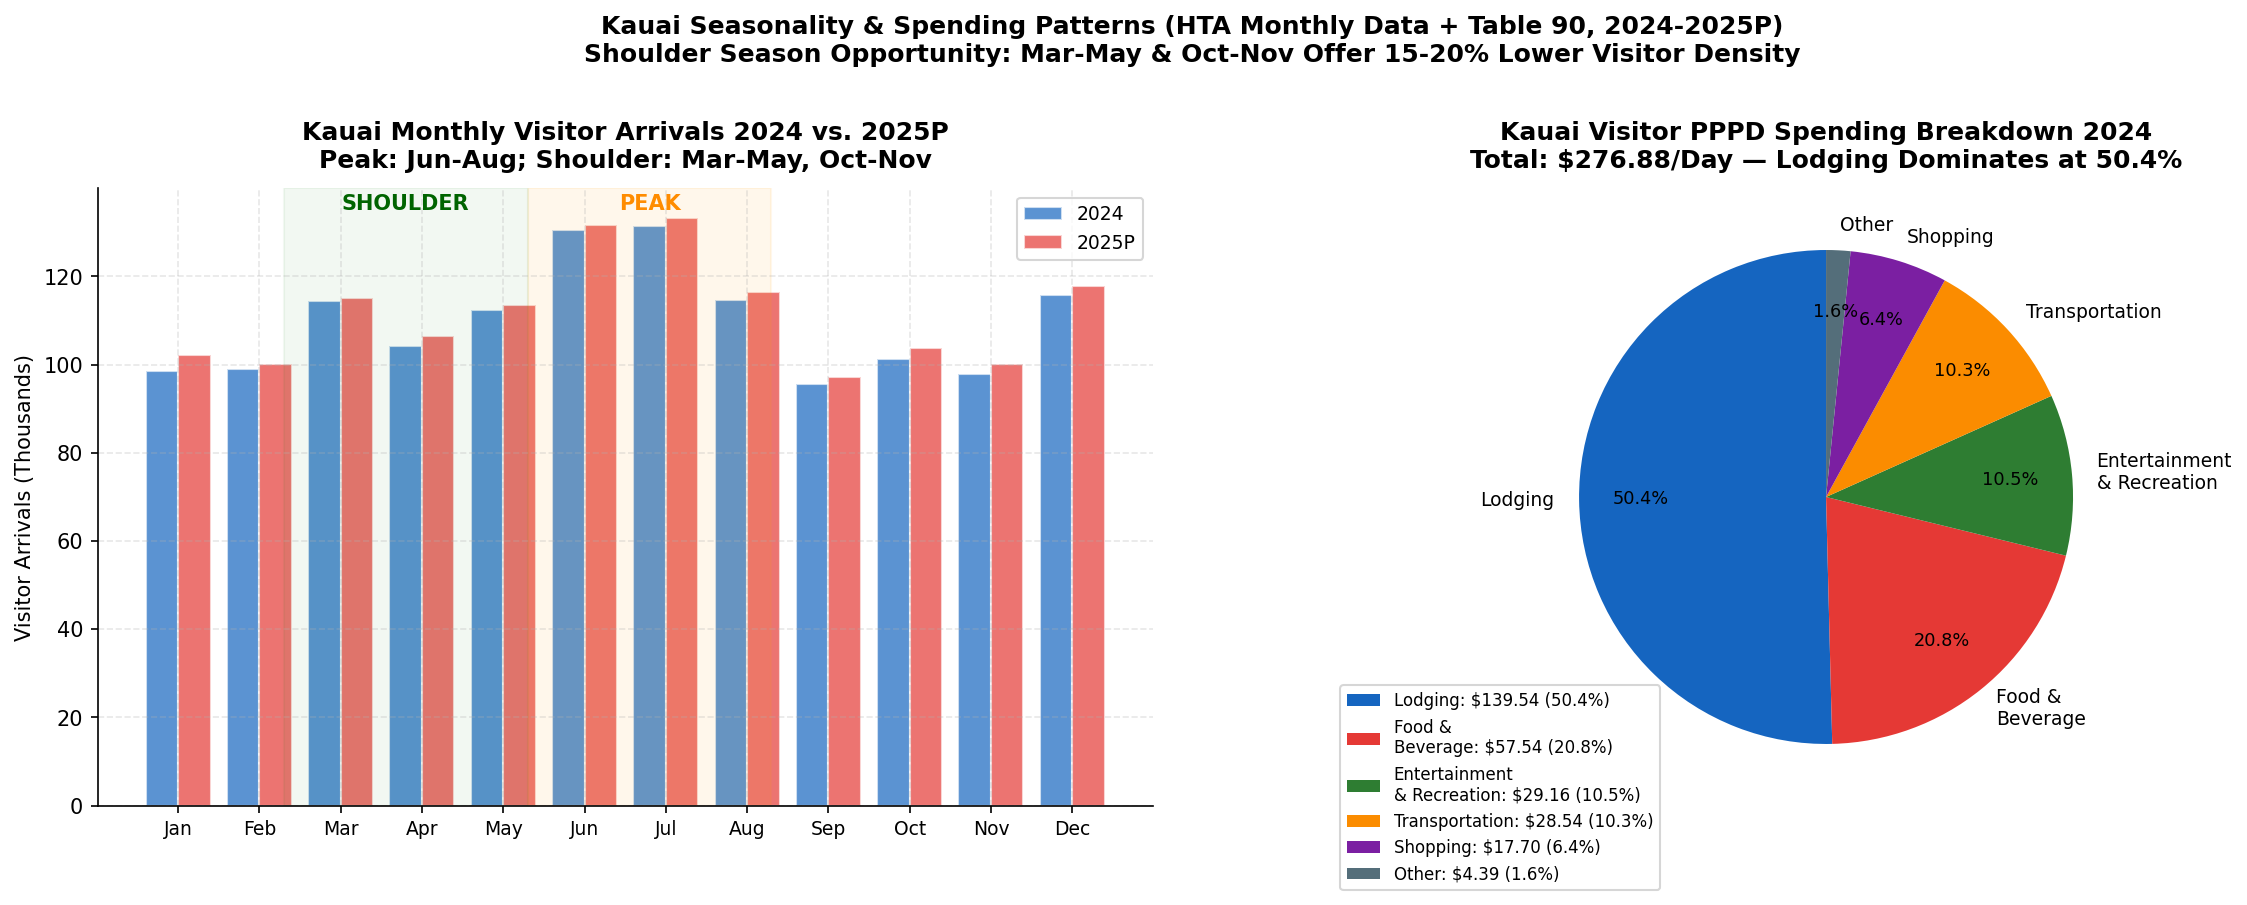
Total visitor expenditures reached $20.1 billion in 2024, with an average per-person-per-day (PPPD) spend of $244.72 — up 1.5% from $241.18 in 2023. The composition of spending is heavily weighted toward lodging (the single largest category), followed by food and beverage, shopping, and entertainment and recreation.
Spending by Island
Kaua'i consistently generates the highest PPPD among the major islands, reflecting its premium accommodation mix and the relative absence of budget options. Lāna'i (Four Seasons) generates the highest PPPD of any island but at negligible visitor volume.
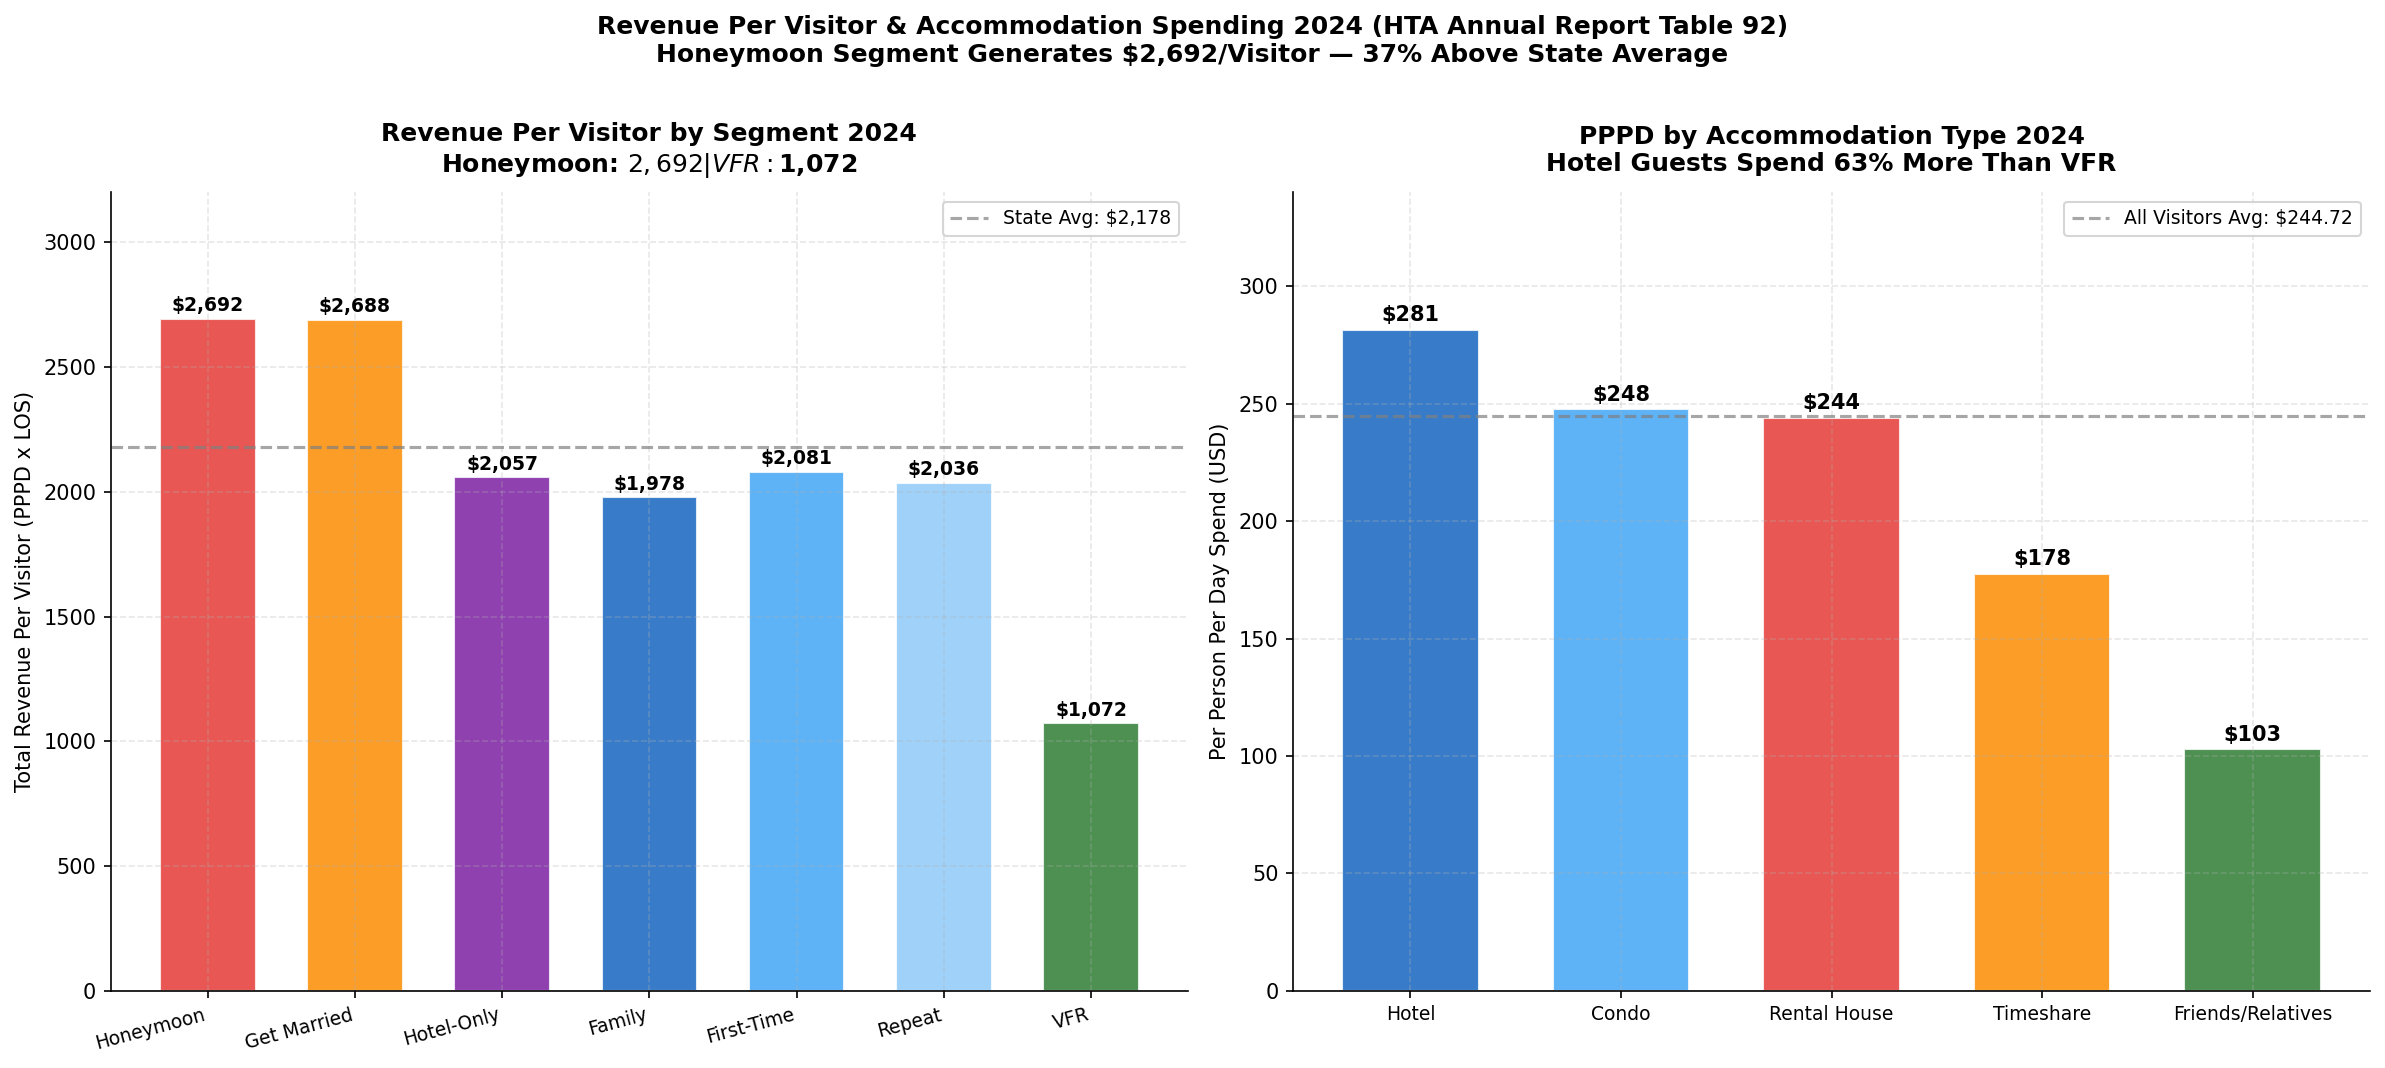
Spending by Accommodation Type
Hotel guests spend significantly more per day than visitors in other accommodation types. This has direct implications for tour operators: visitors staying in hotels are the highest-value target for add-on tour products.
Spending by Market
Japan visitors, despite lower overall volume, generate among the highest PPPD of any market — particularly for shopping and food and beverage. The incentive travel segment from Japan (41,336 visitors in 2025) is a particularly high-value niche, with group-organized itineraries that include pre-arranged tour and activity components.
Path 3: Accommodation Performance
Hotel Market Overview
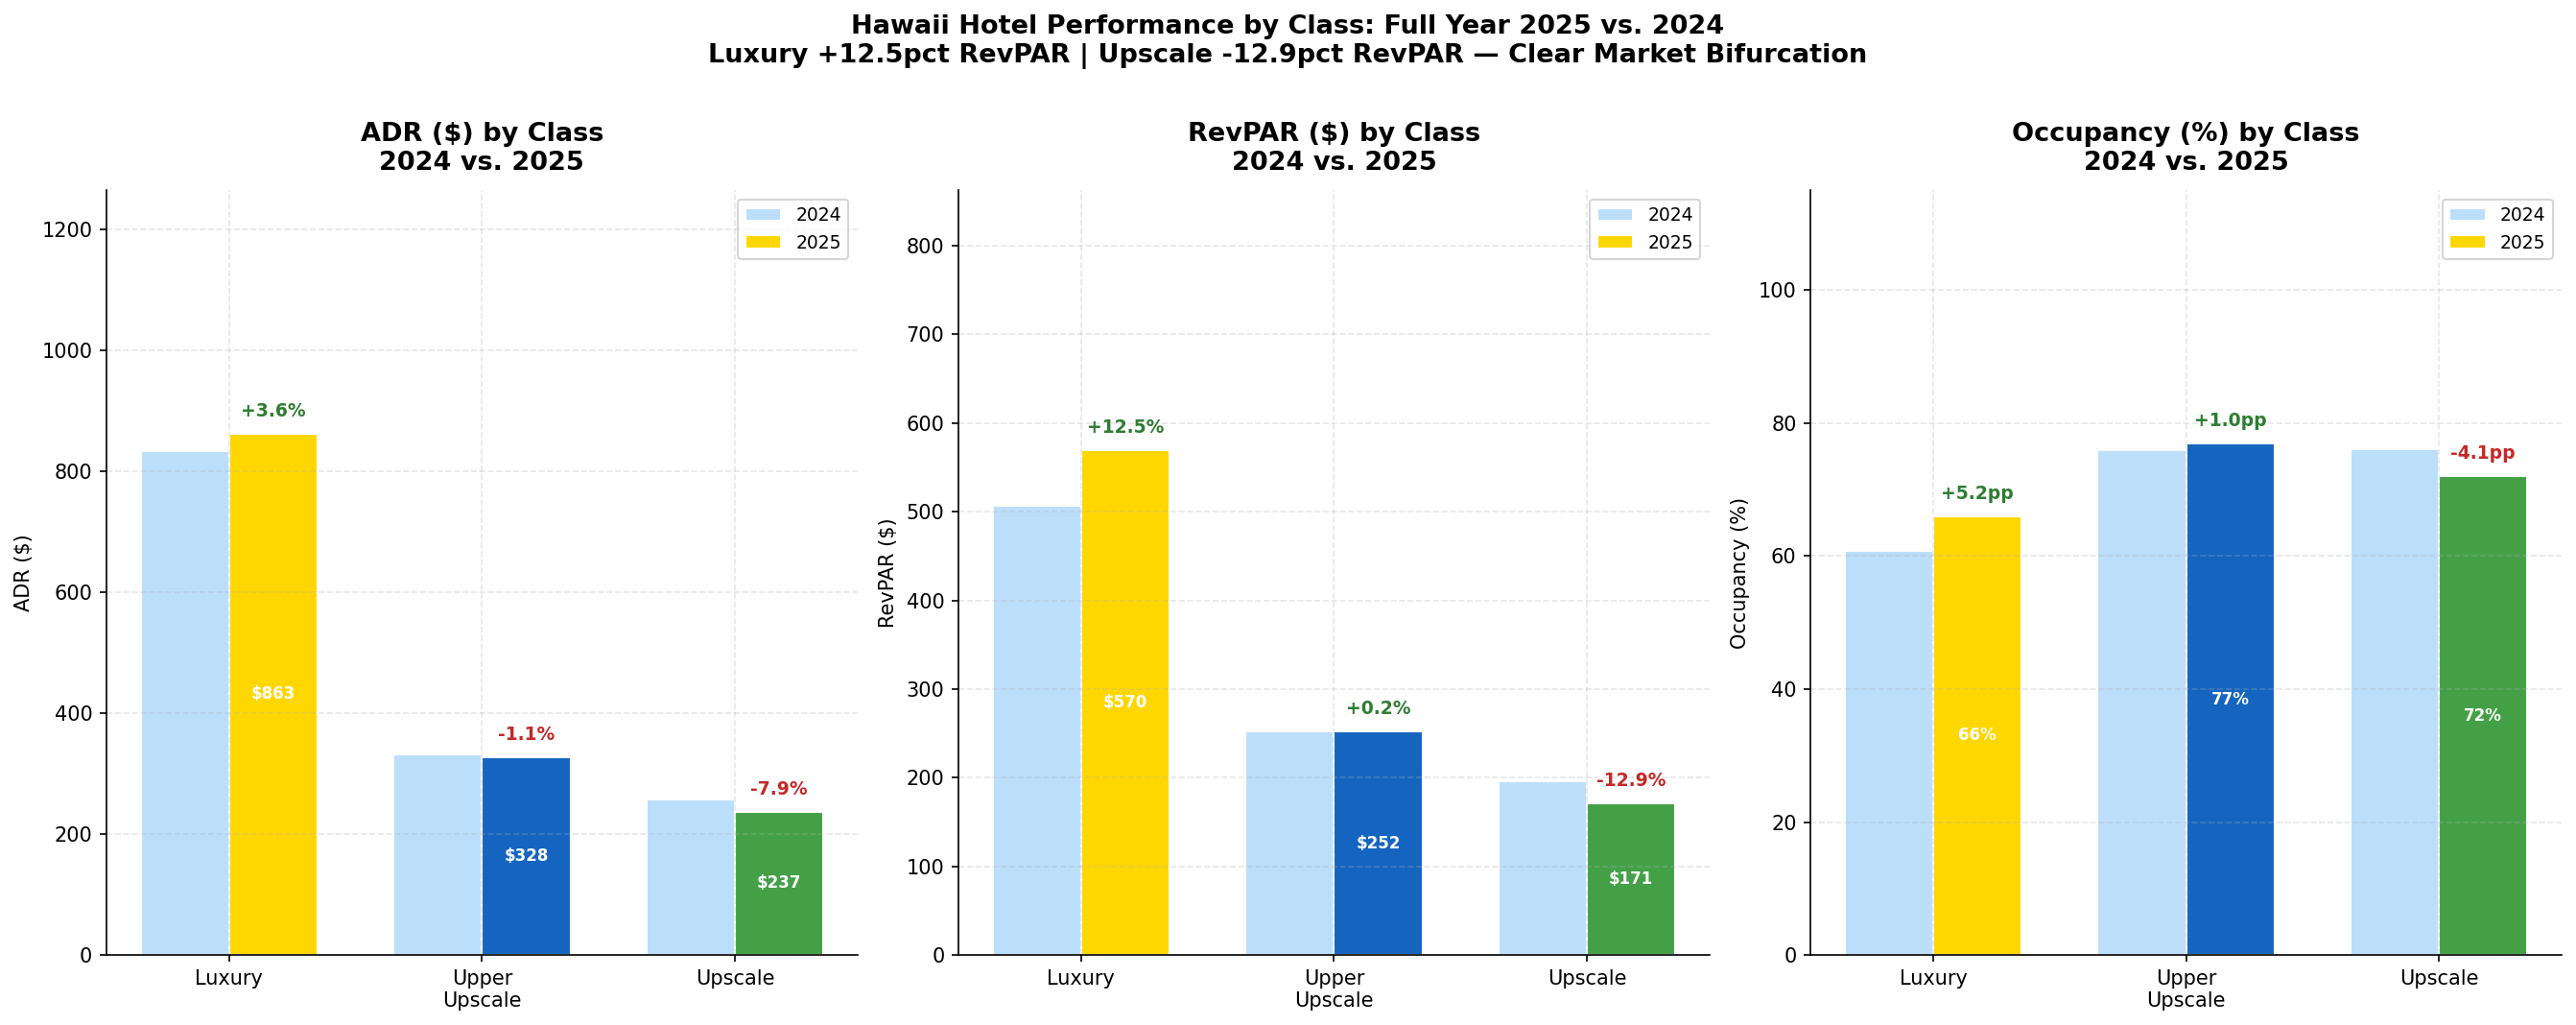
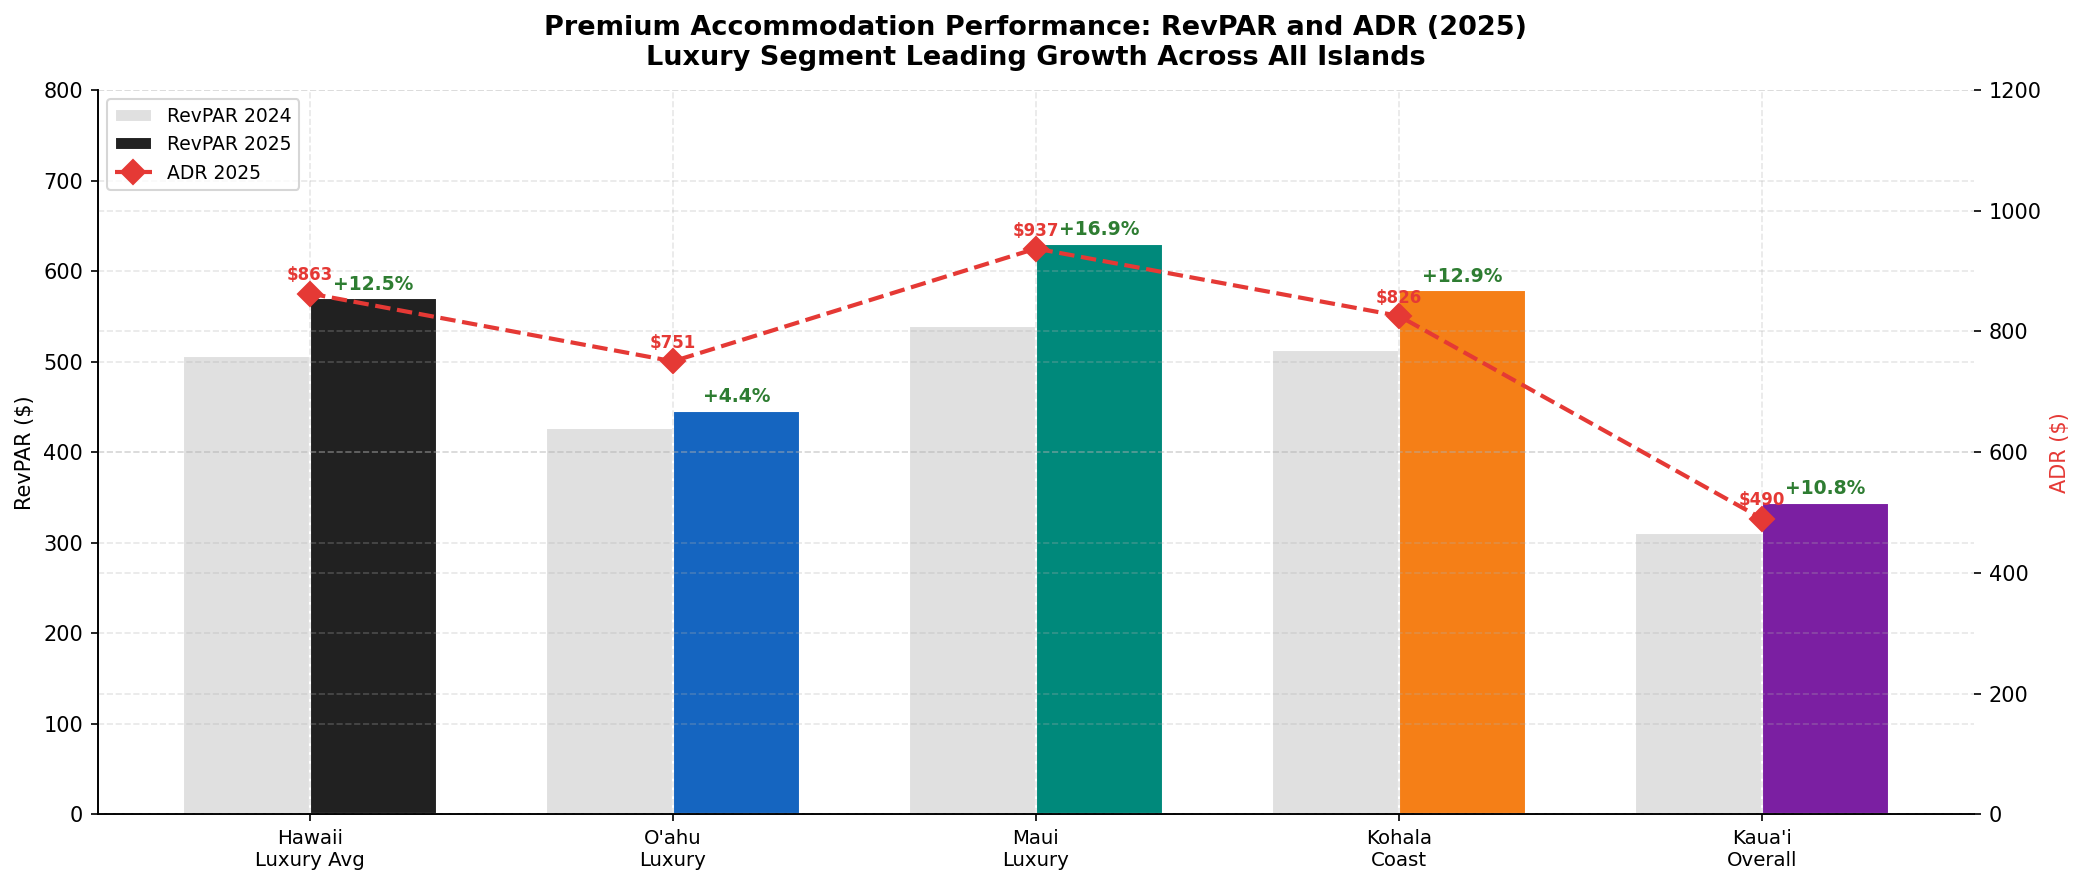
Hawaii's hotel market delivered strong performance in 2025, with statewide average daily rate (ADR) of approximately $312 and RevPAR of approximately $249 — both above pre-pandemic levels in nominal terms. Occupancy averaged approximately 79.8% statewide, with meaningful variation by island and hotel class.
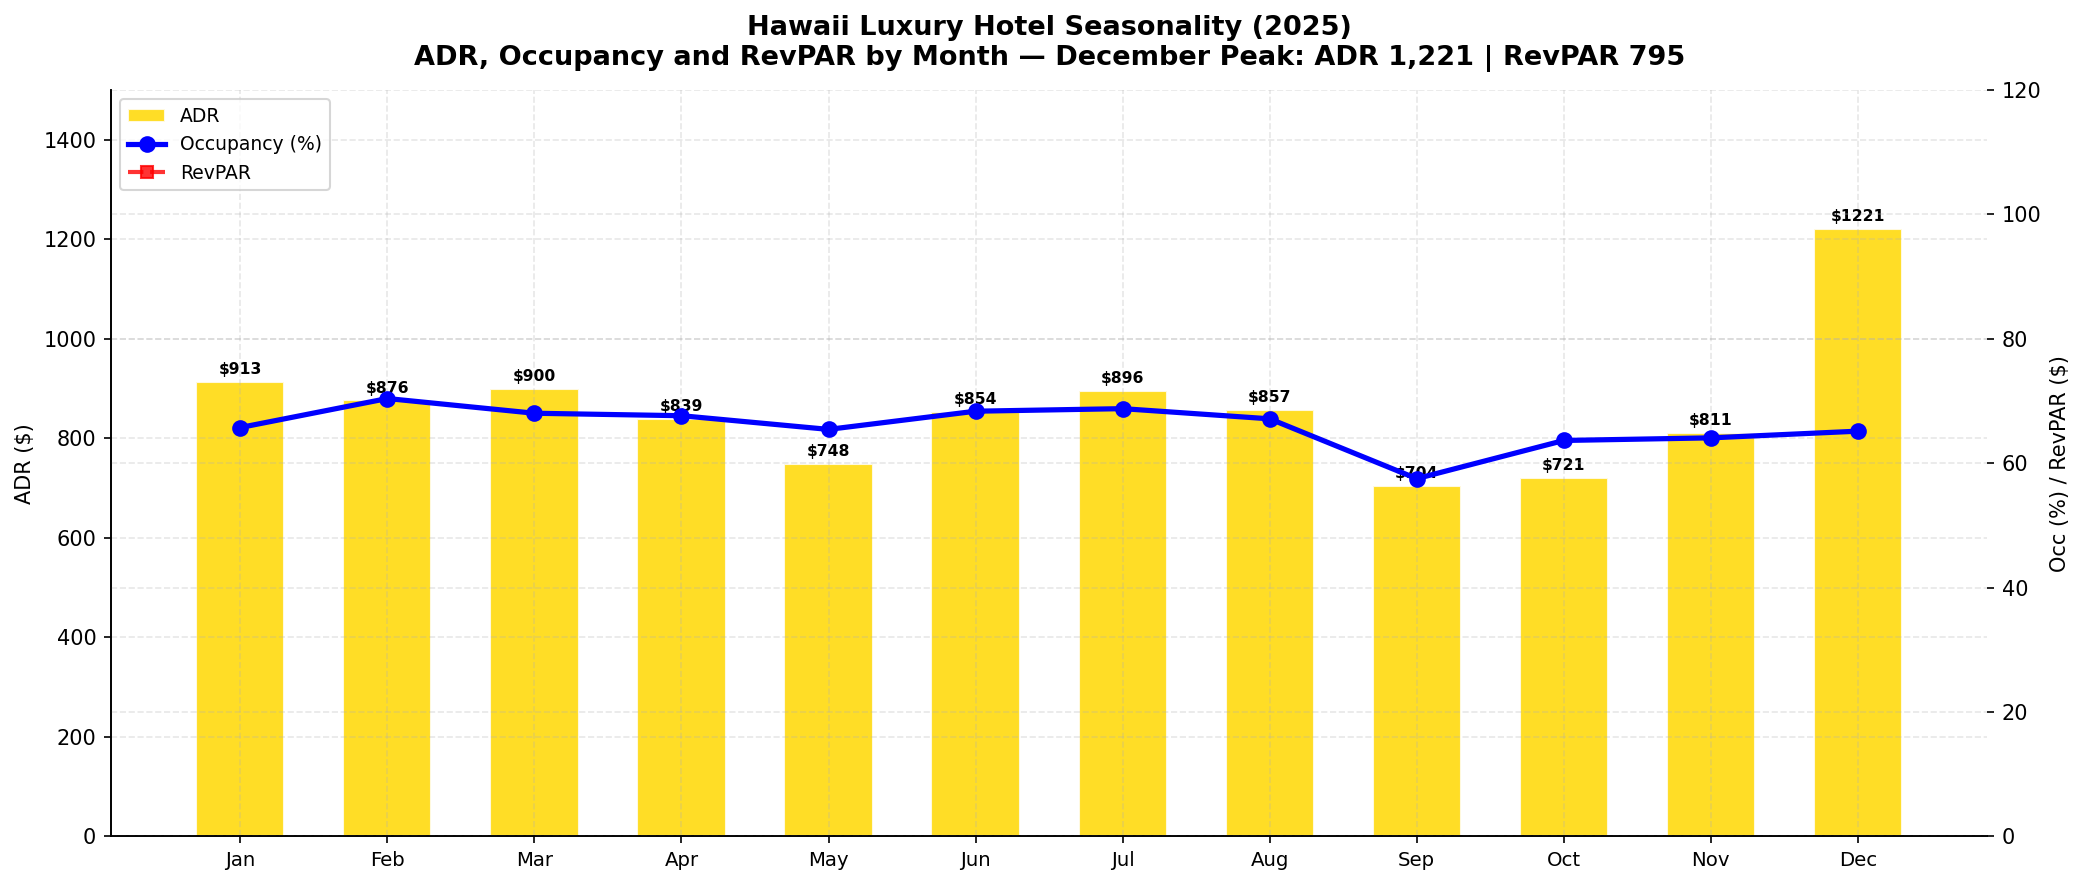
Performance by Hotel Class
The luxury and upper-upscale segments — the most relevant for a premium tour operator's hotel partnerships — significantly outperform the overall market.
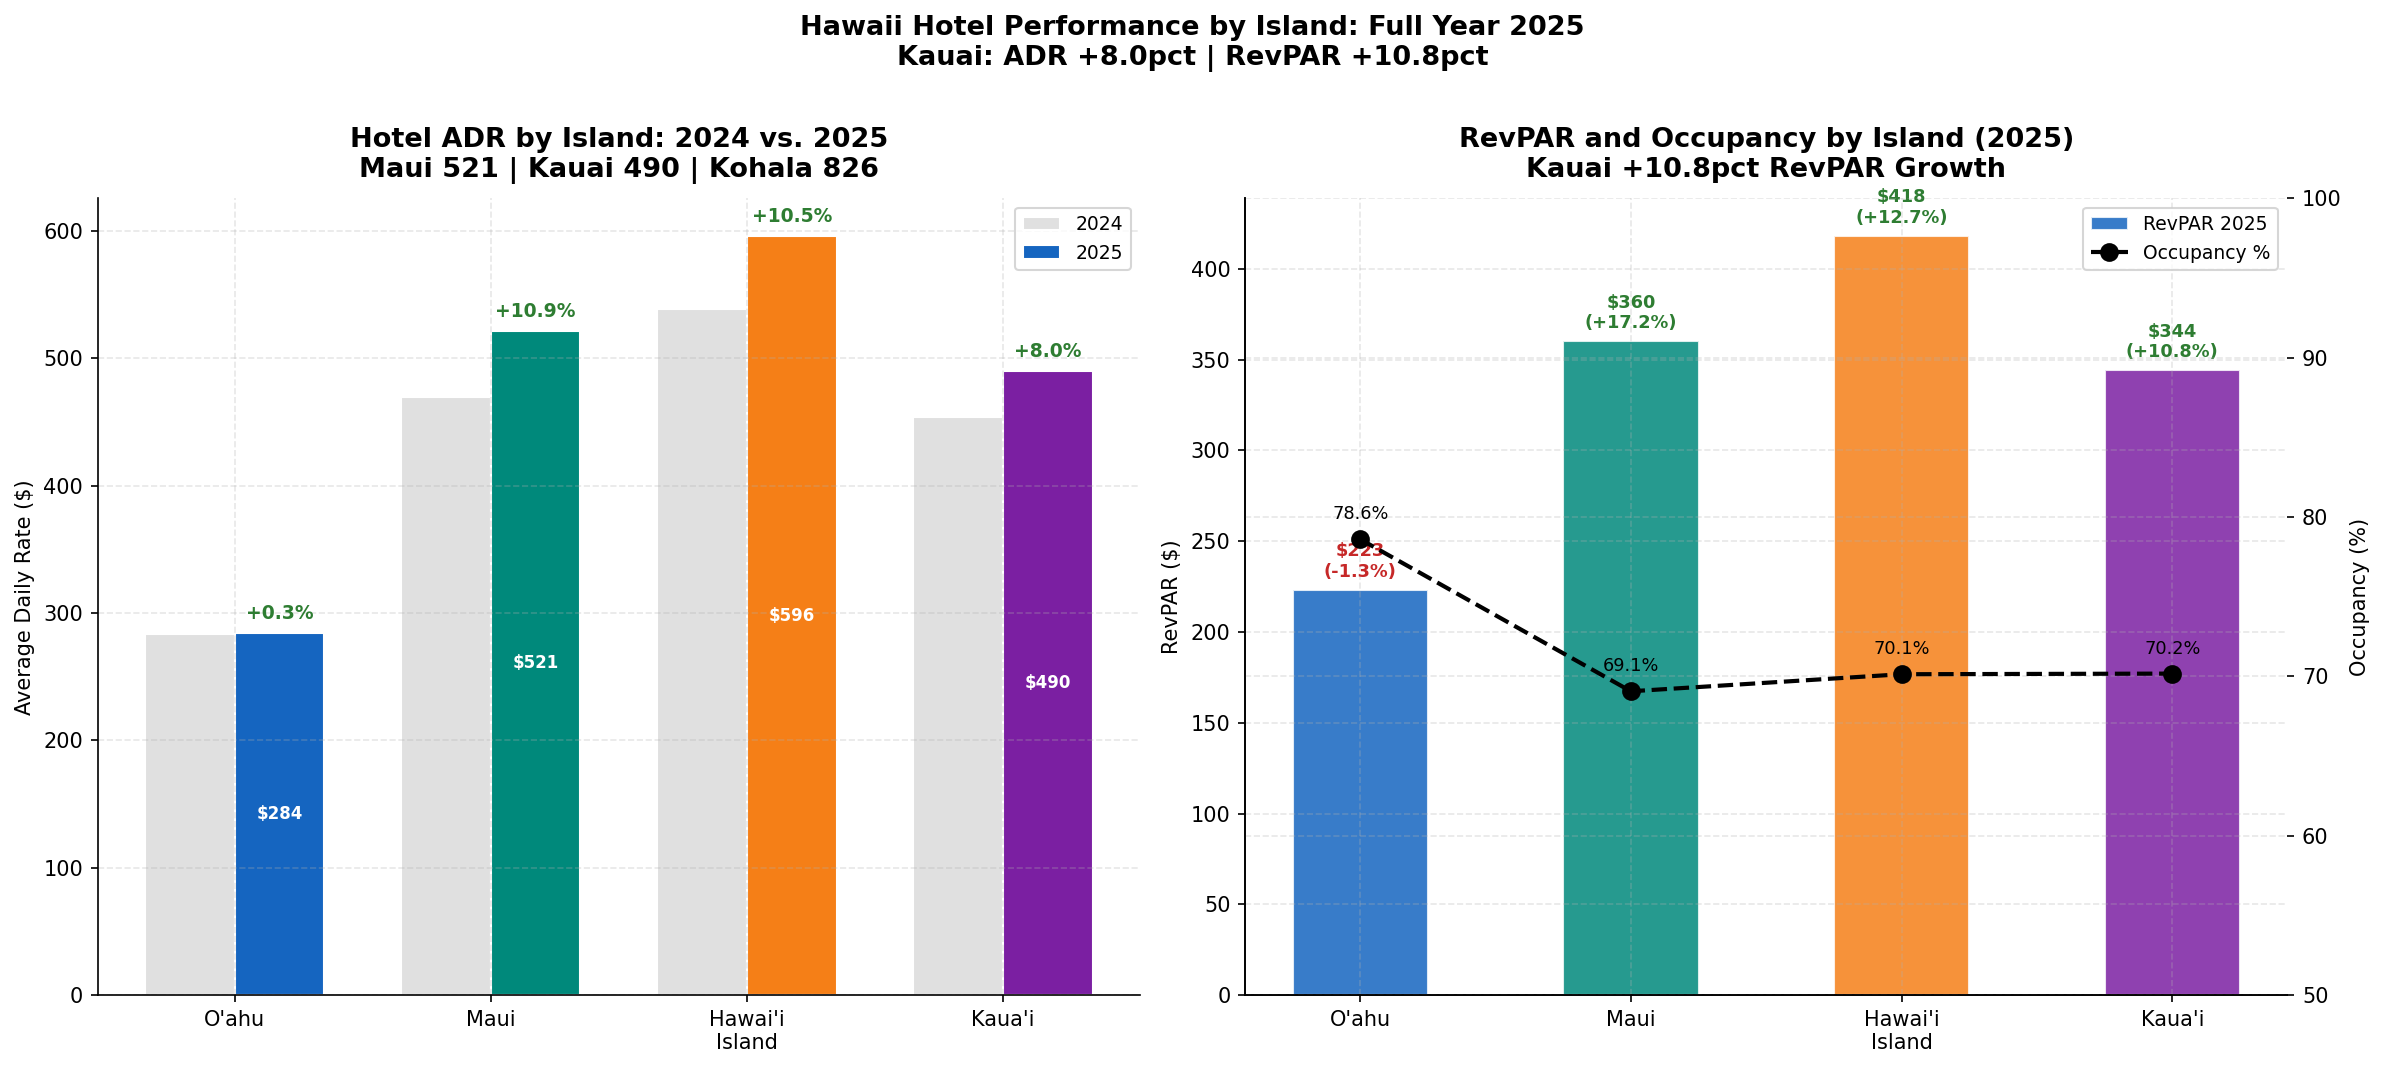
Kaua'i Hotel Performance
Kaua'i's luxury hotels command ADR of $499–$542, with occupancy in the 73–76% range. The island's limited hotel supply (approximately 3,200 hotel rooms statewide, concentrated in Princeville and Po'ipū) creates natural scarcity that supports premium pricing. Kaua'i hotel RevPAR consistently runs 35–40% above the statewide average.
Vacation Rental Market
The vacation rental market on Kaua'i is significant — the island has a higher vacation rental penetration than O'ahu or Maui as a share of total accommodation units. Average vacation rental ADR on Kaua'i runs approximately $380–$420 for premium properties, with occupancy of 68–72%. For a premium tour operator, vacation rental guests represent a distinct and growing segment: they tend to be repeat visitors, travel in larger parties (families), and have longer stays.
Path 4: Visitor Satisfaction, Behavior & Activities
Overall Satisfaction
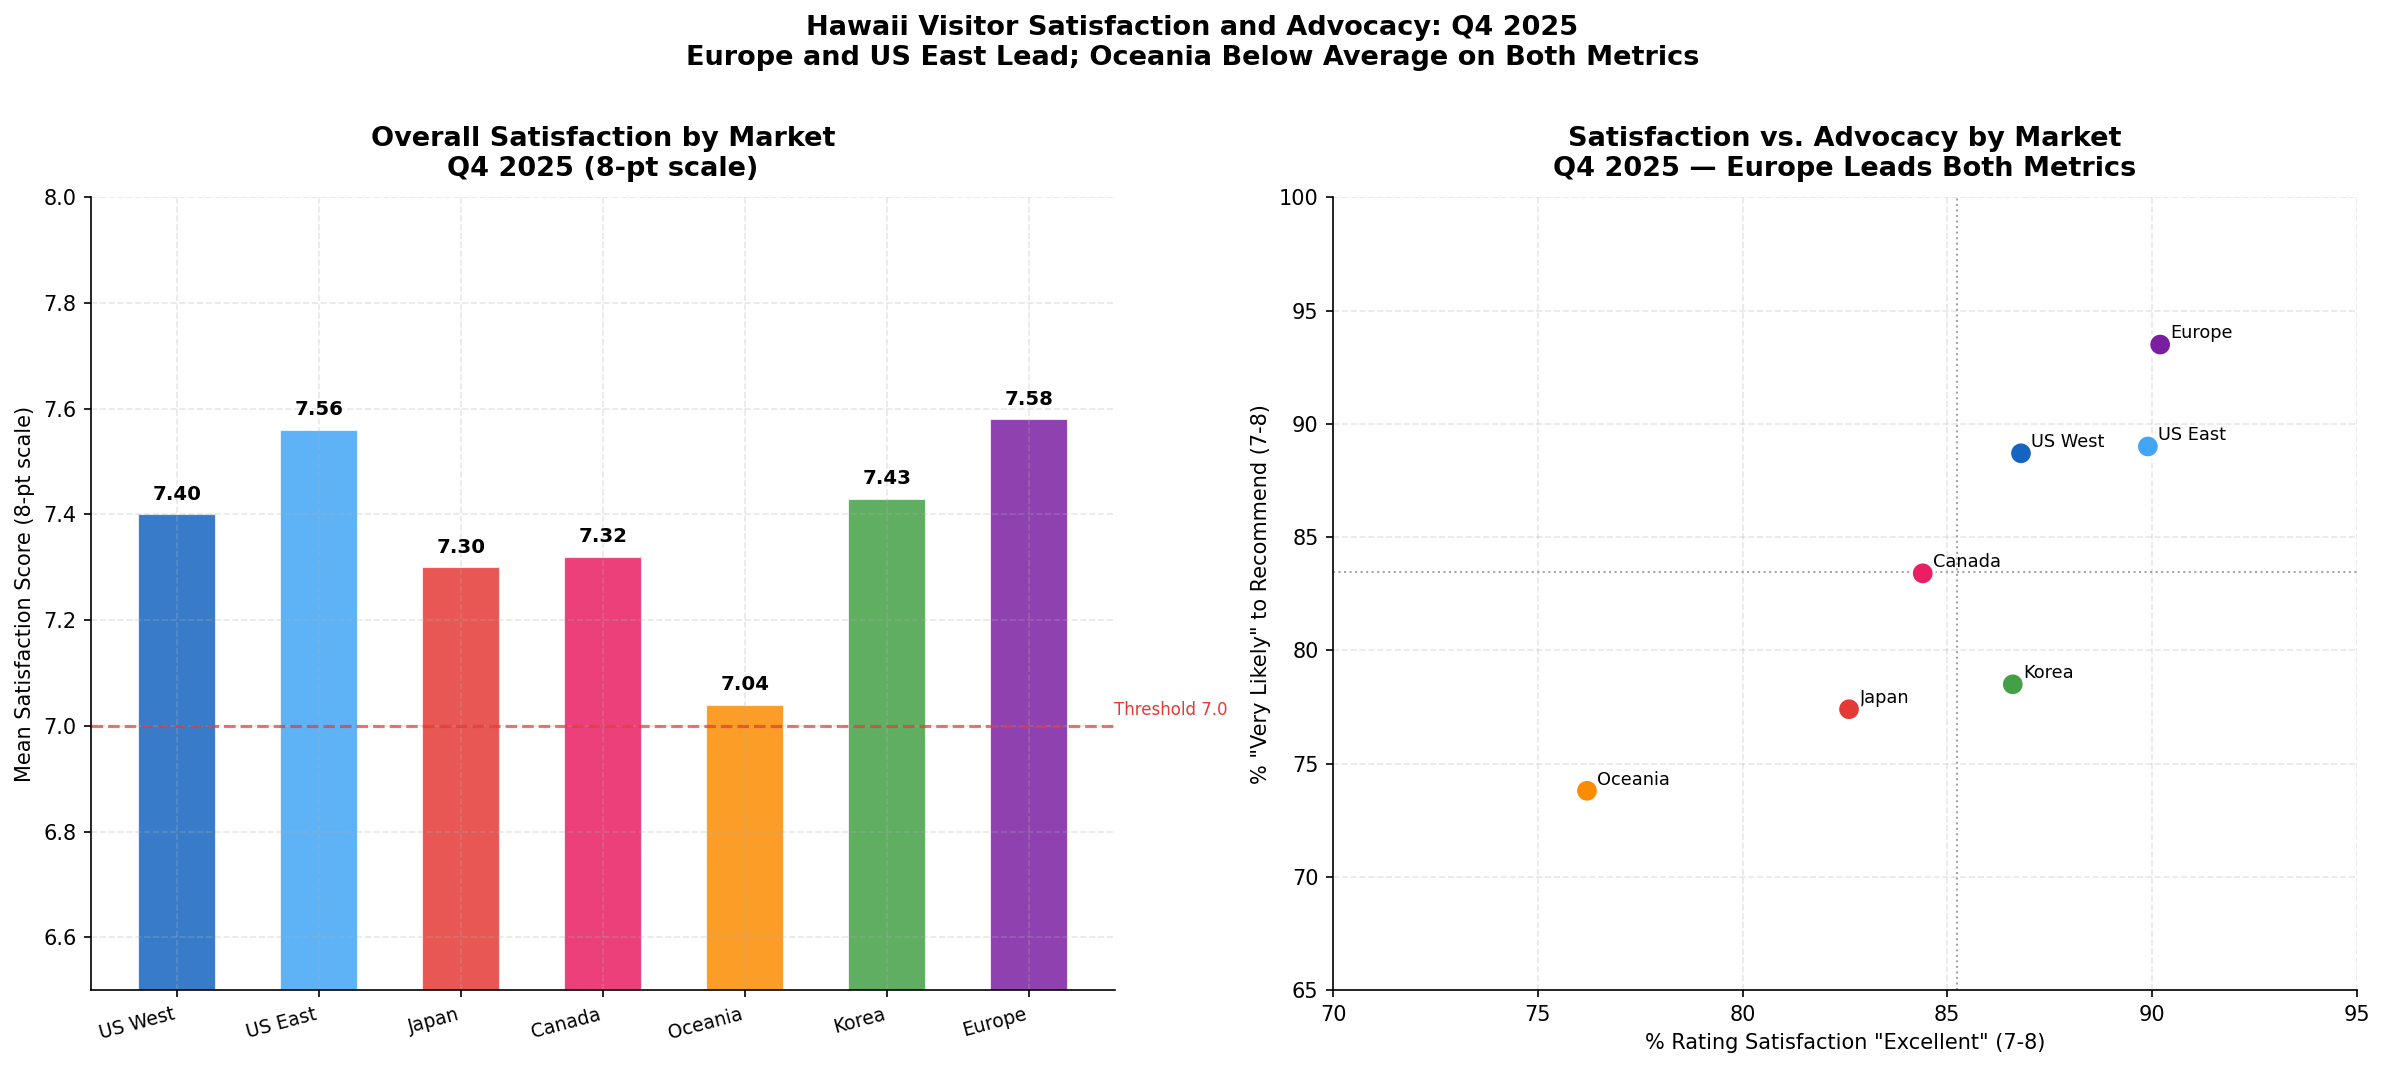
Hawaii's visitor satisfaction scores remain among the highest of any destination globally. The VSAT Q4 2025 report shows overall satisfaction at 8.7/10 statewide, with Kaua'i scoring 8.9/10 — the highest of any island. The Net Promoter Score (likelihood to recommend) is 78 for Kaua'i vs. 71 for the state overall.
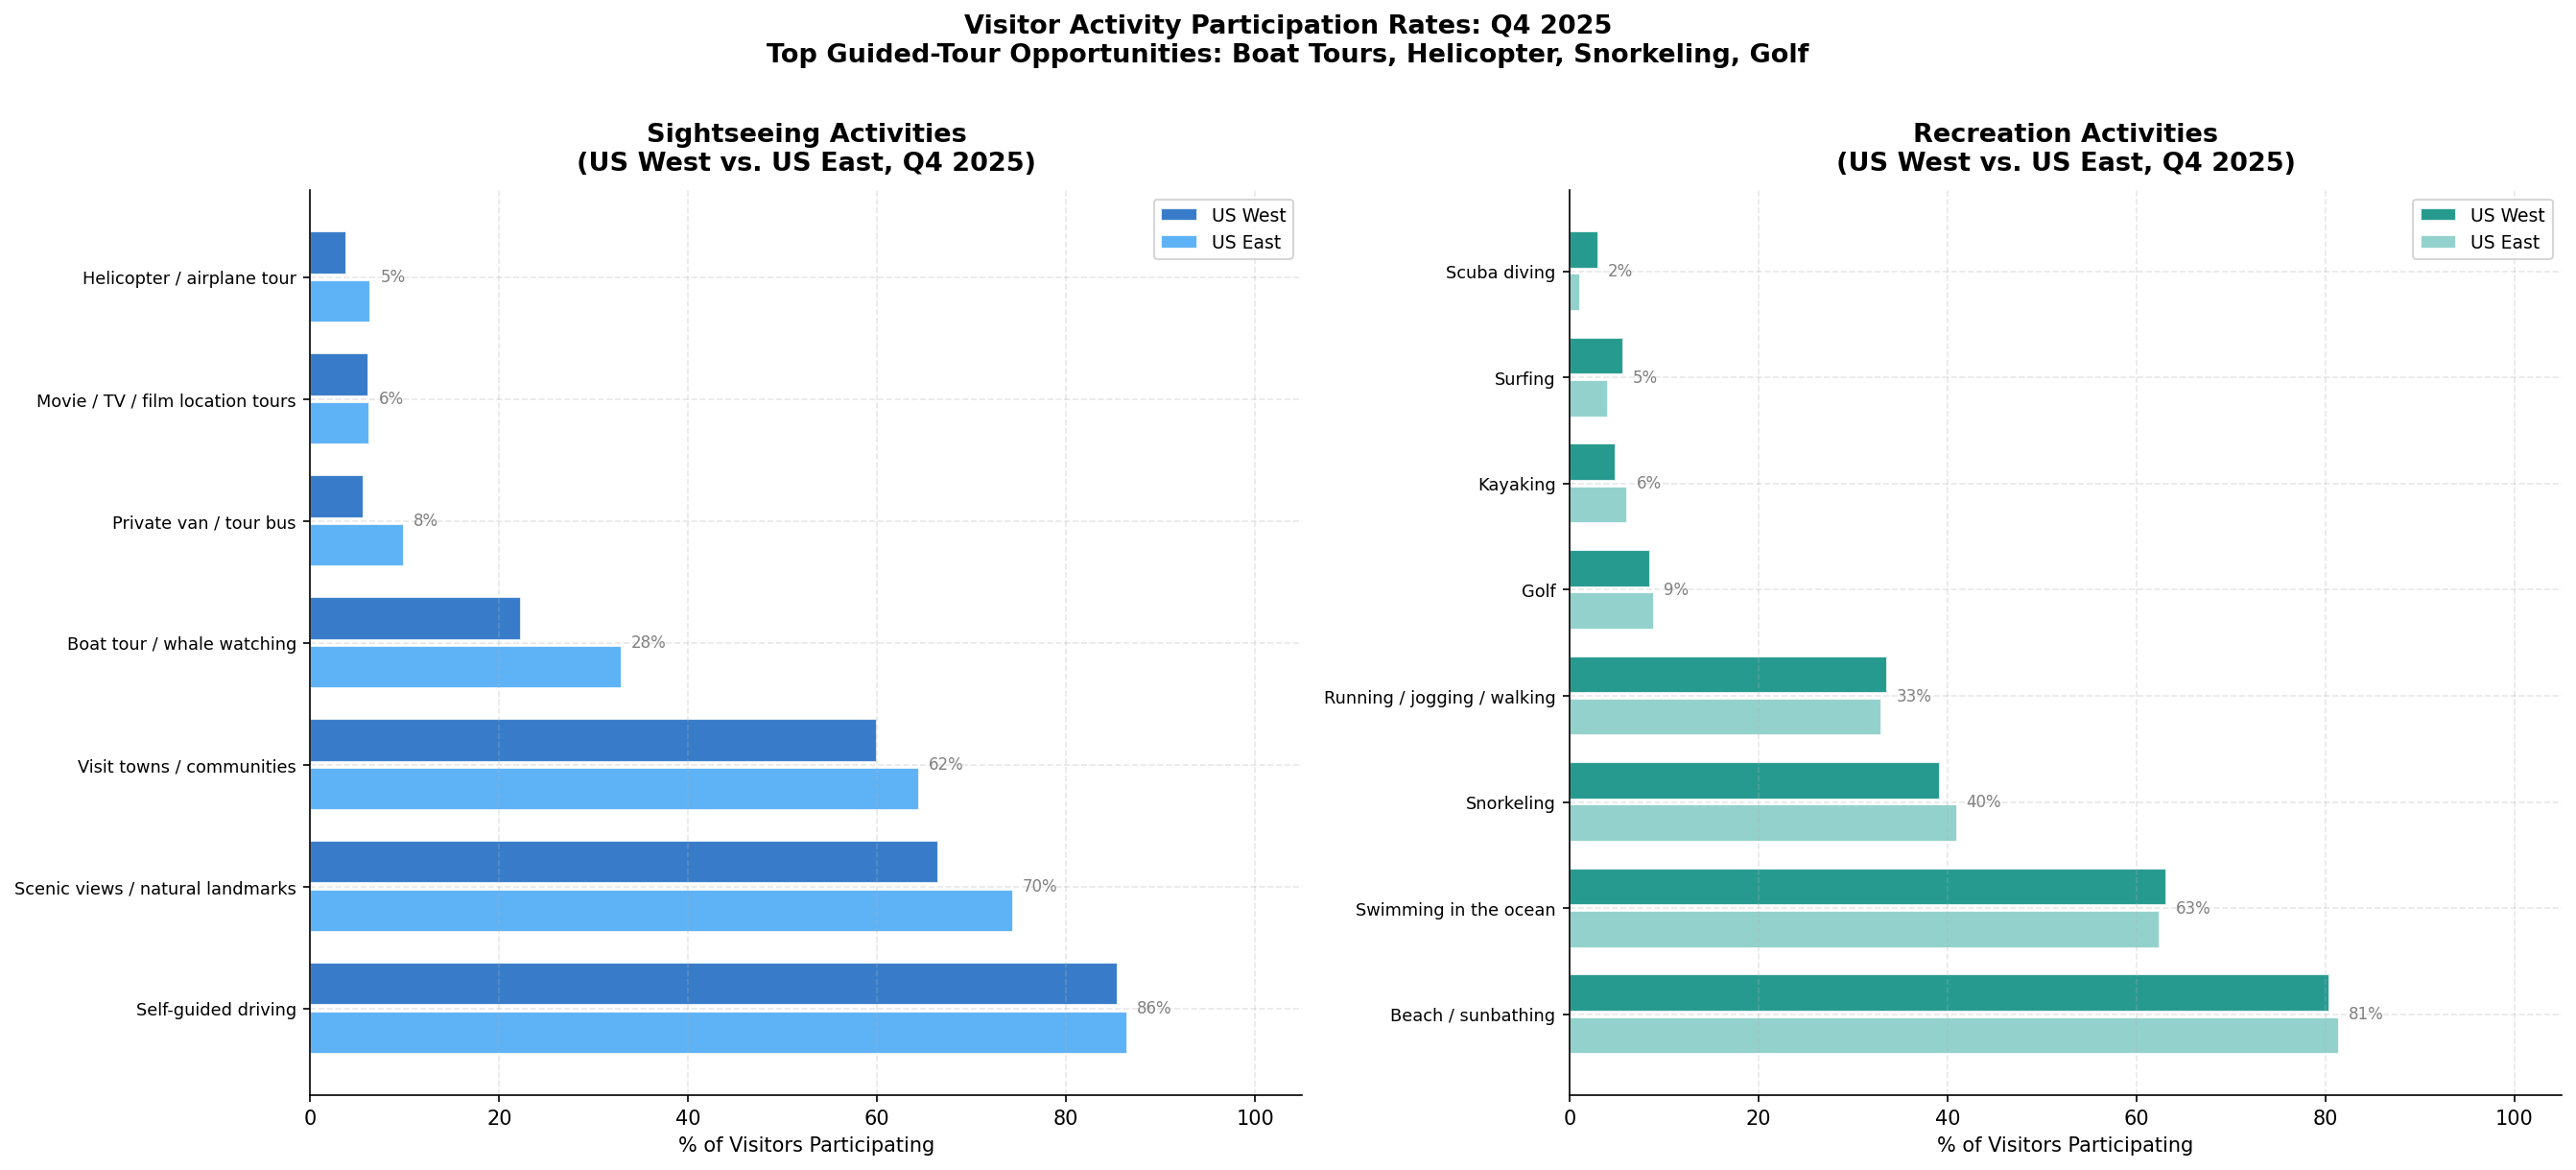
Activities Participation
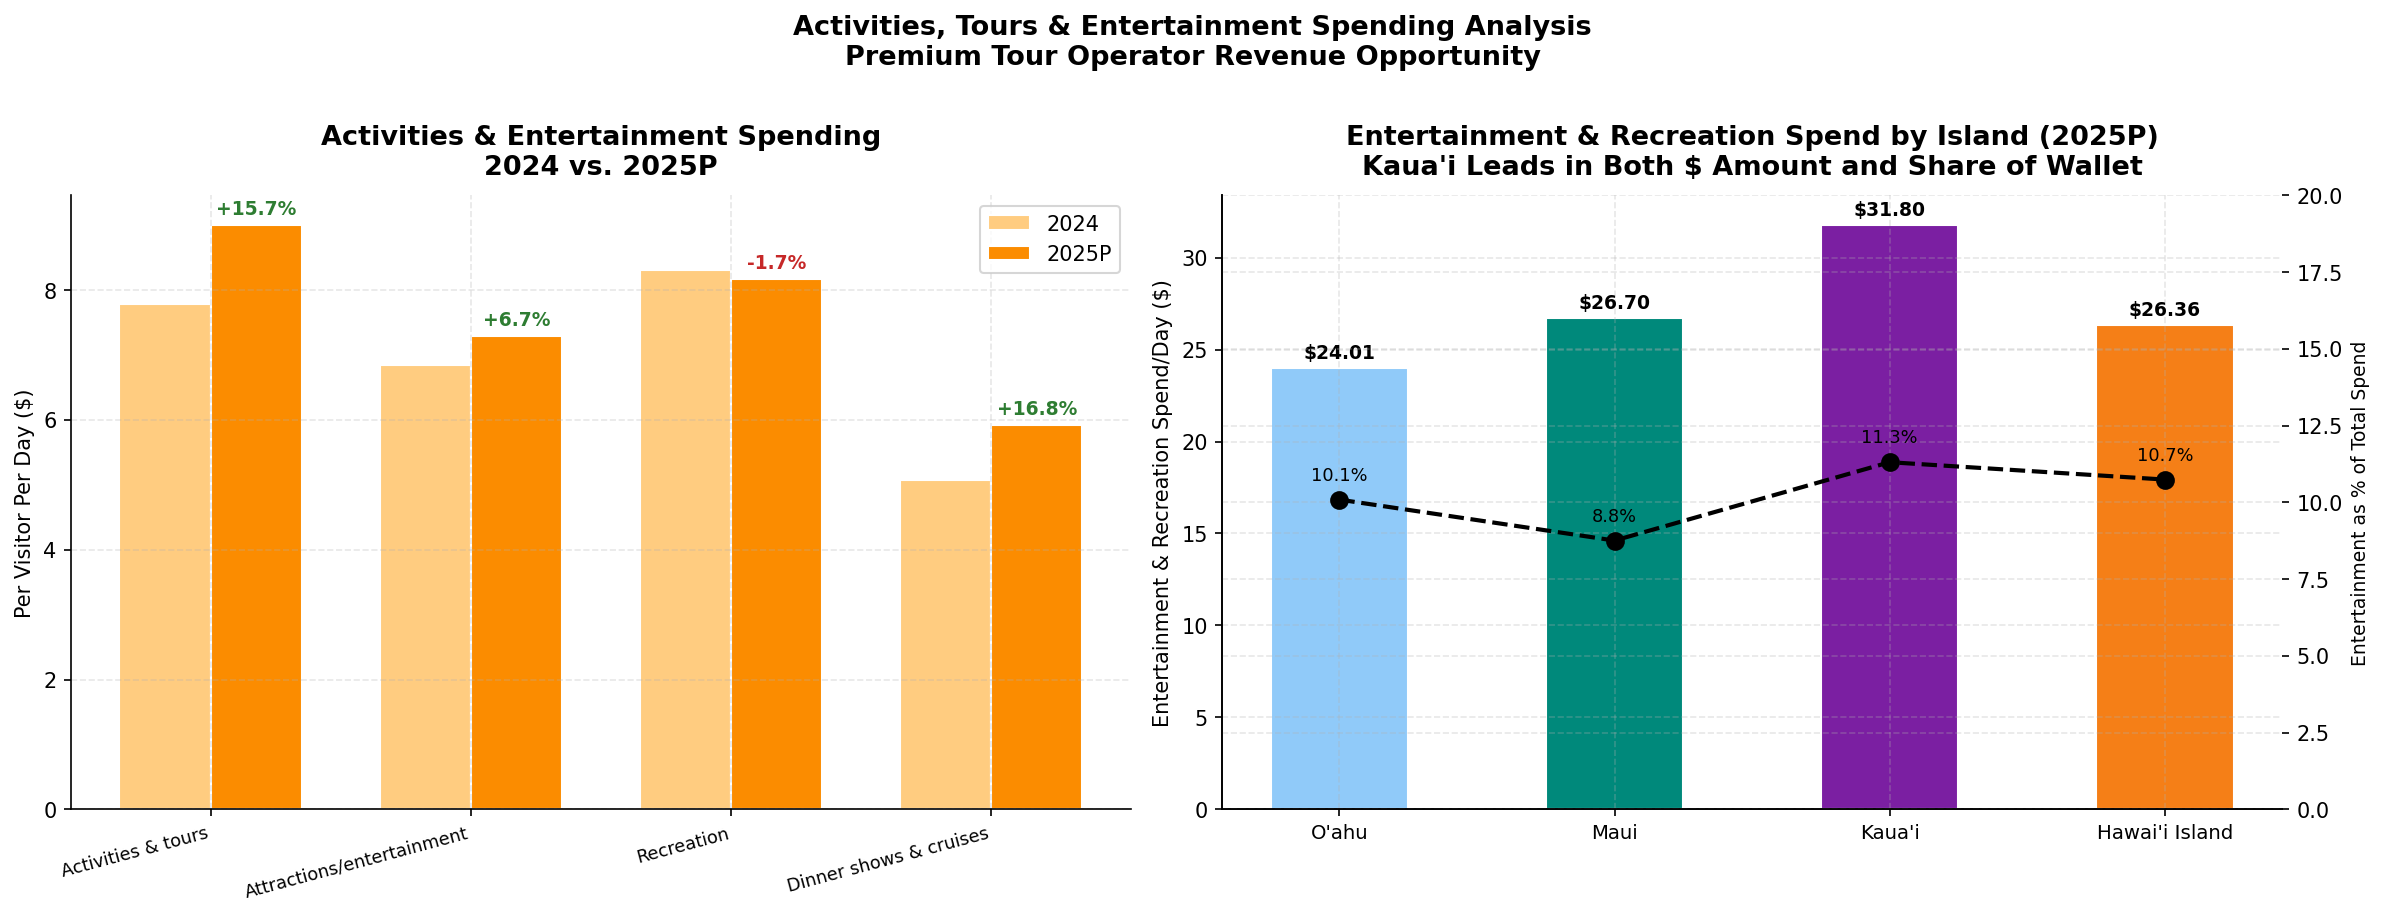
The most commonly participated-in activities reveal the dominant role of nature-based and water experiences — precisely the category where a premium tour operator can differentiate through quality, exclusivity, and guided expertise.
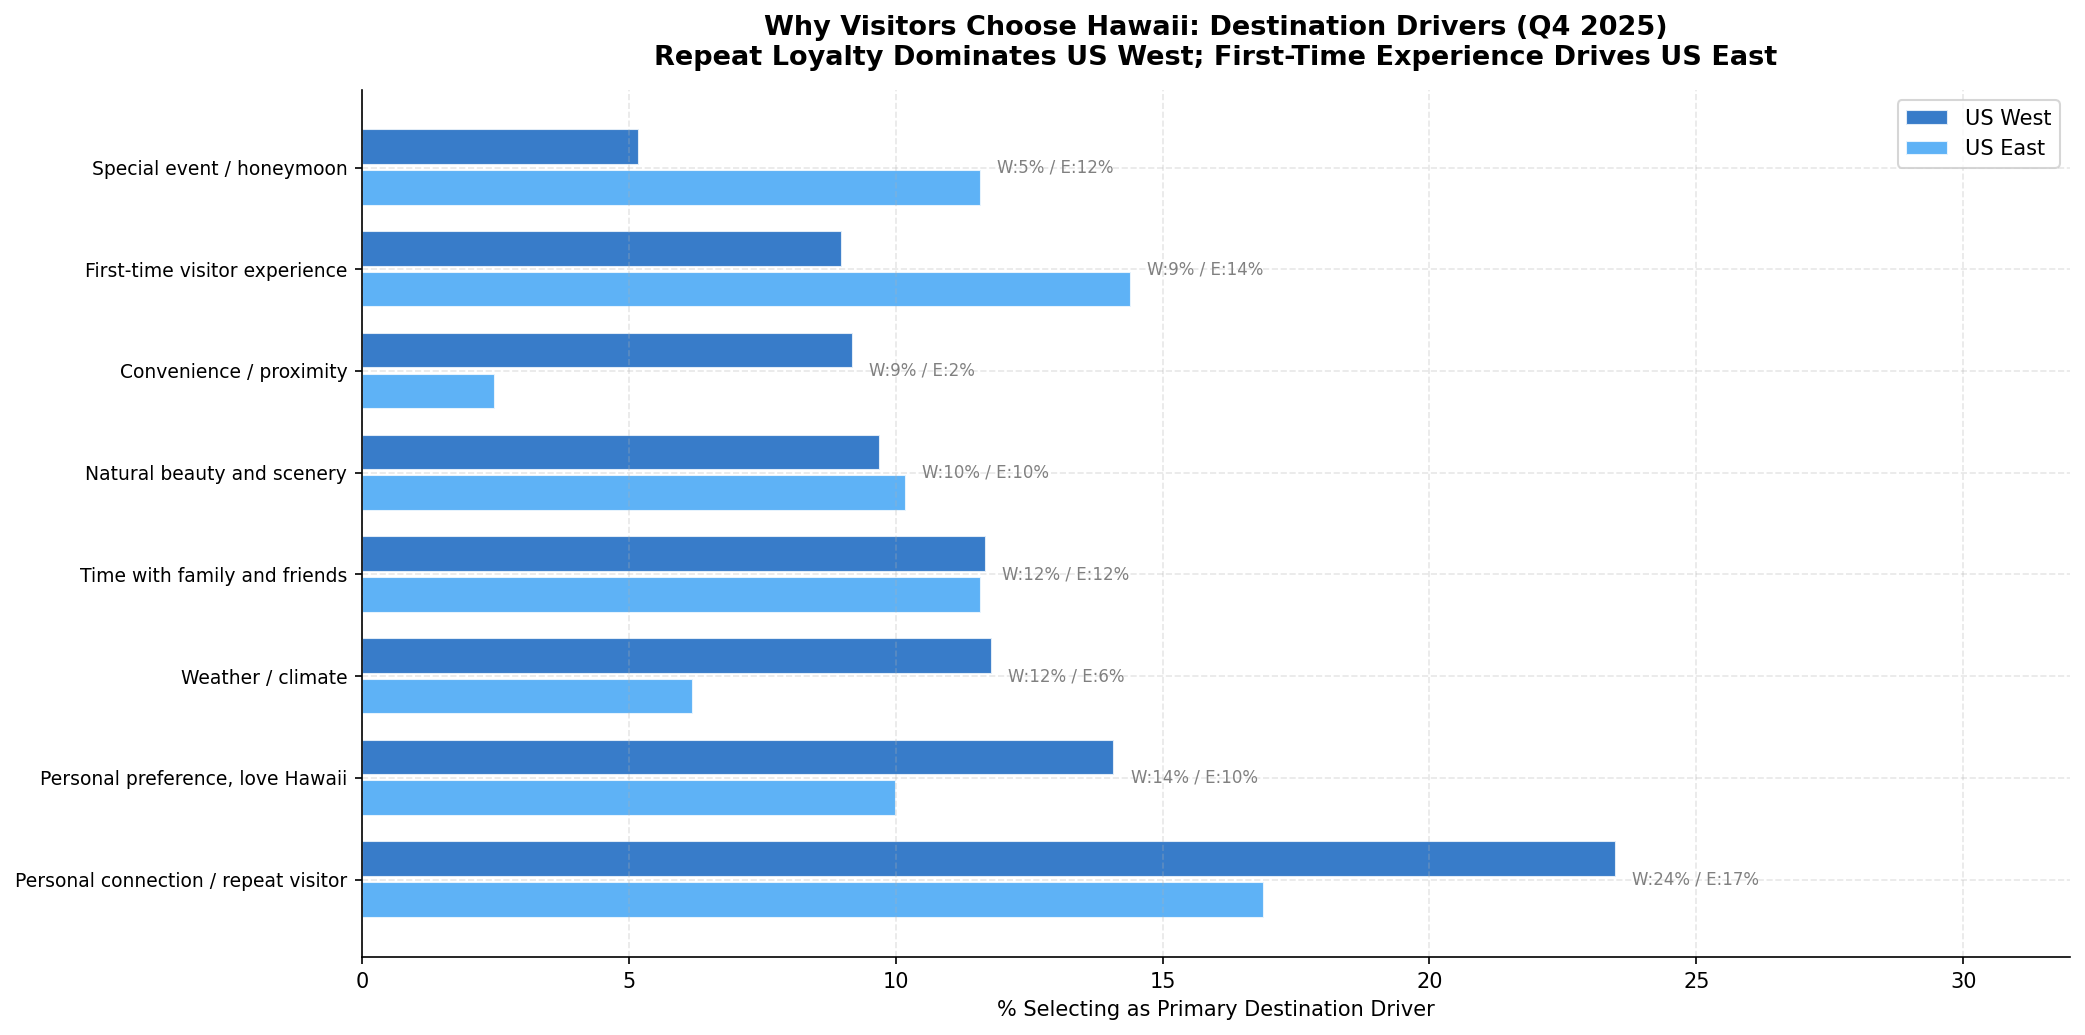
Destination Drivers
The top factors driving visitors to choose Hawaii (and Kaua'i specifically) are: natural beauty/scenery (87%), beaches (82%), weather/climate (79%), and unique cultural experiences (61%). For a premium tour operator, the alignment between these drivers and the activities portfolio is strong — natural beauty and cultural authenticity are the core of any premium guided experience.
Visitor Profile from VSAT
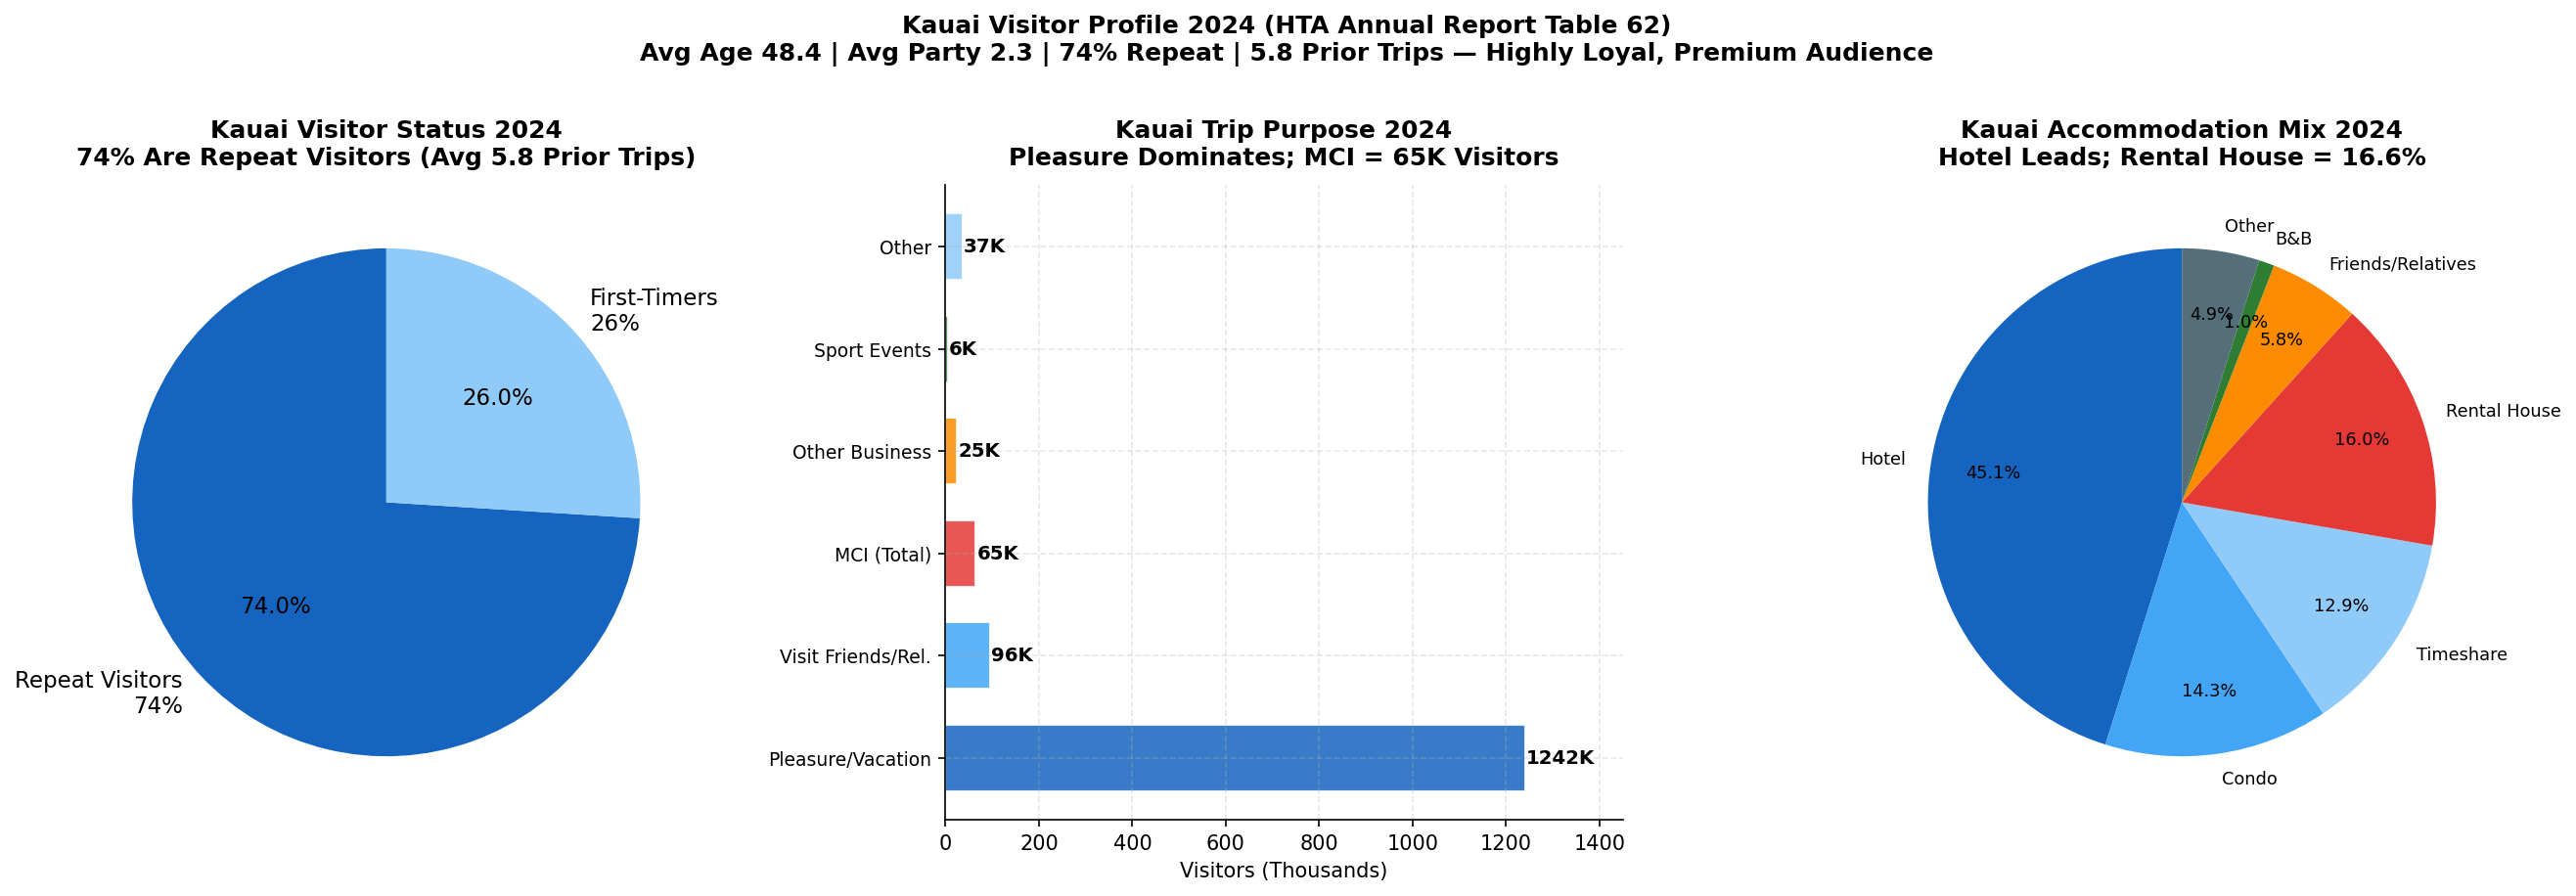
- Average age: 44.2 years (Kaua'i: 46.1)
- First-time visitors: 29.1% statewide; 24.8% on Kaua'i (more repeat-heavy)
- Average party size: 2.4 persons
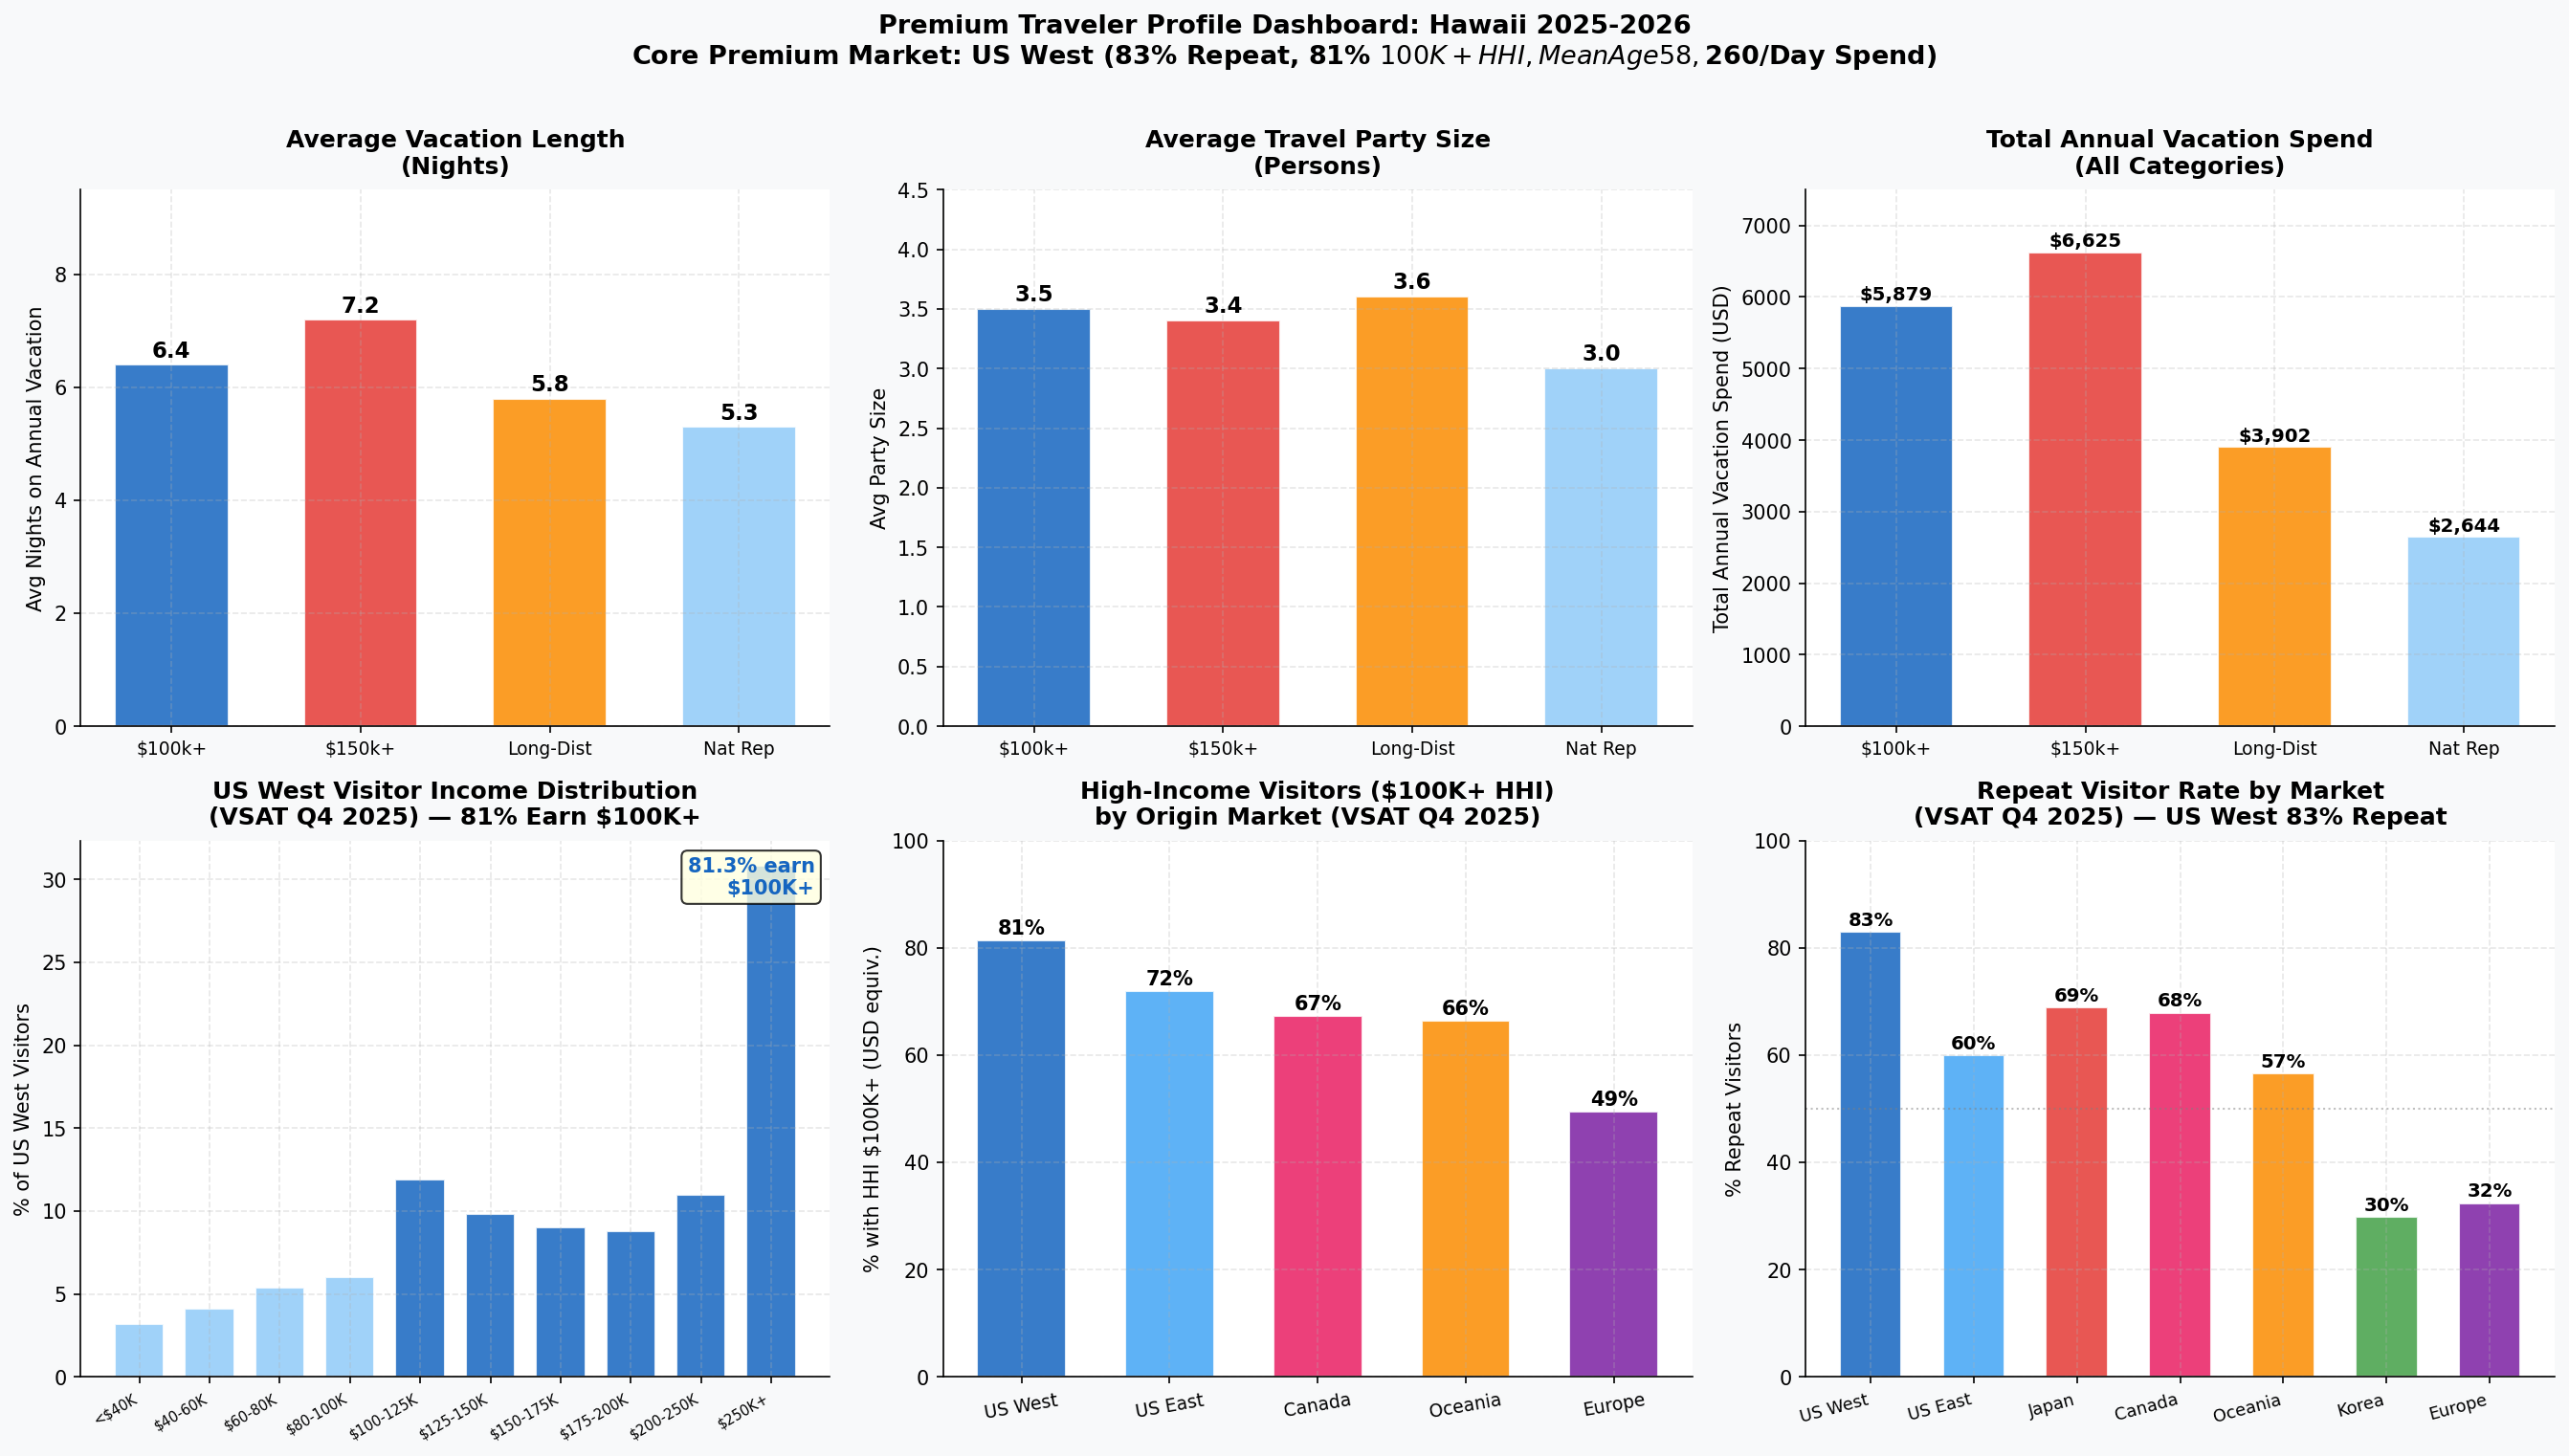
- Average household income: $125,000+ for 58% of Kaua'i visitors
Path 5: Traveler Profiles & Premium Segmentation
The Premium Hawaii Traveler
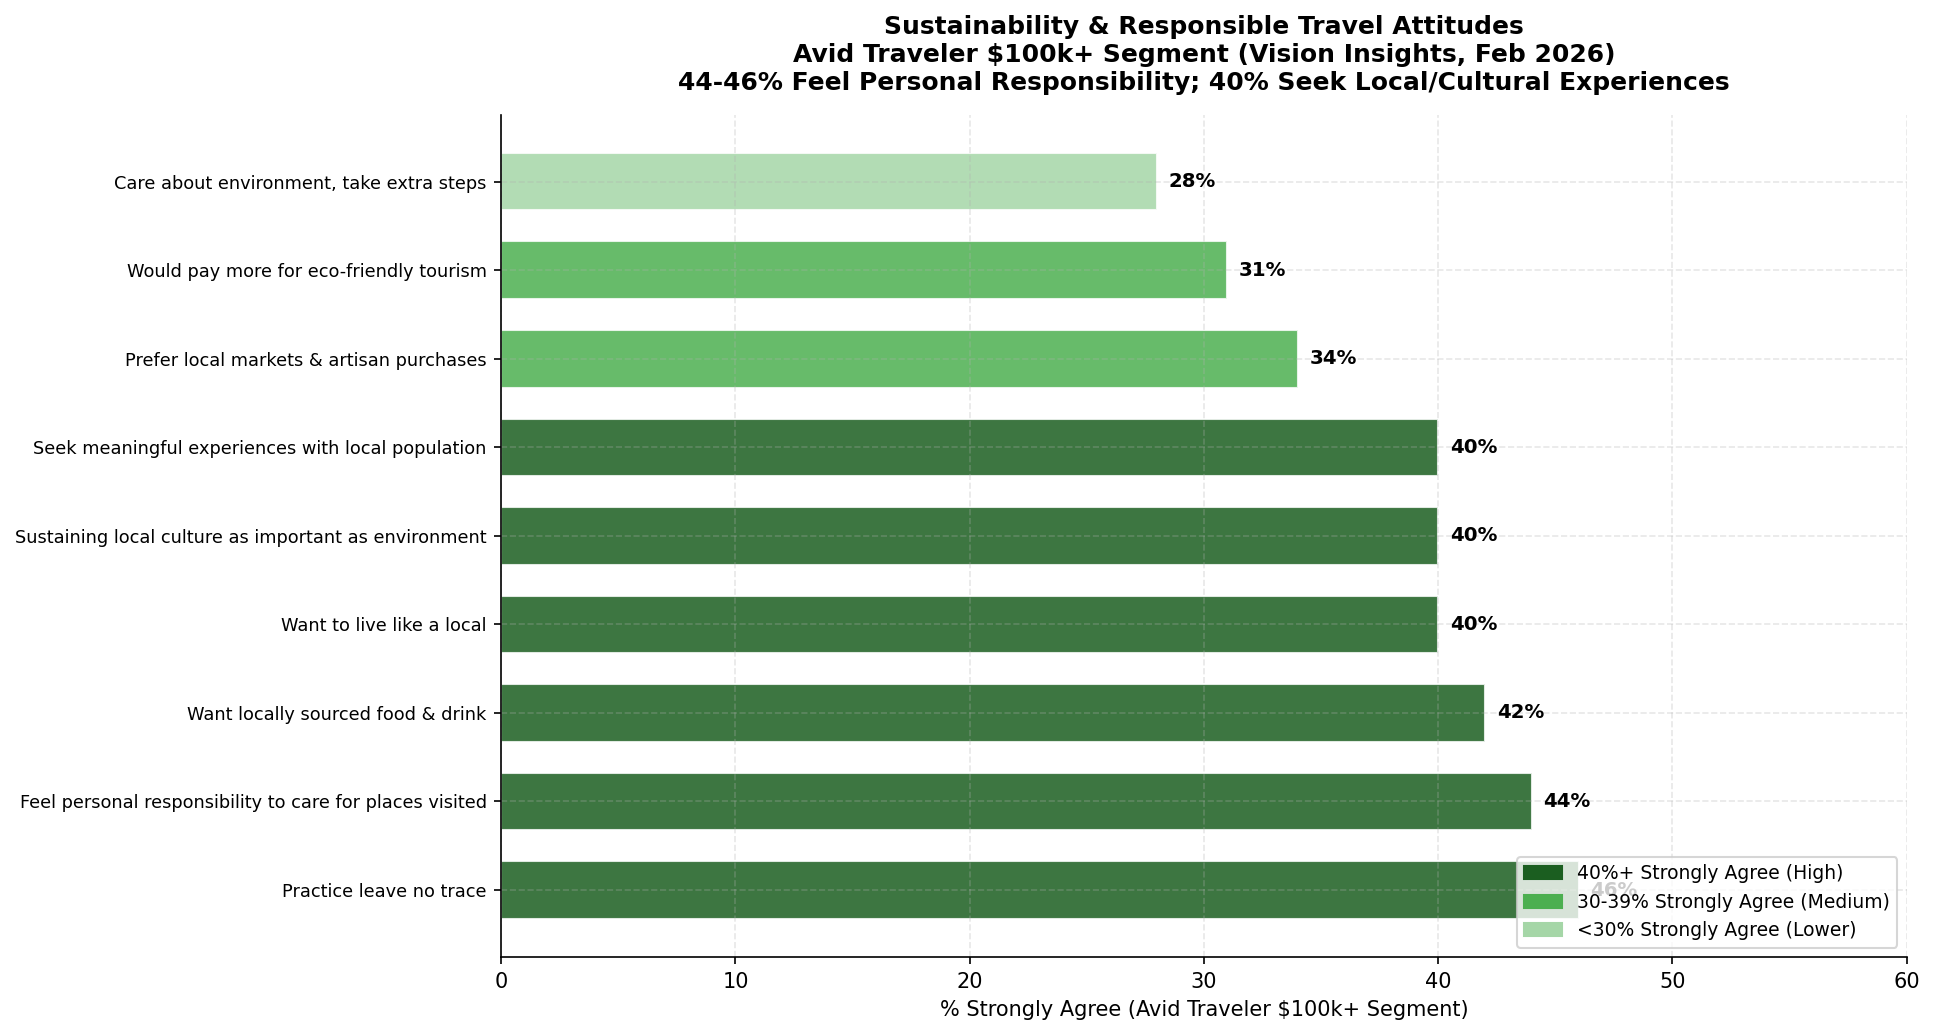
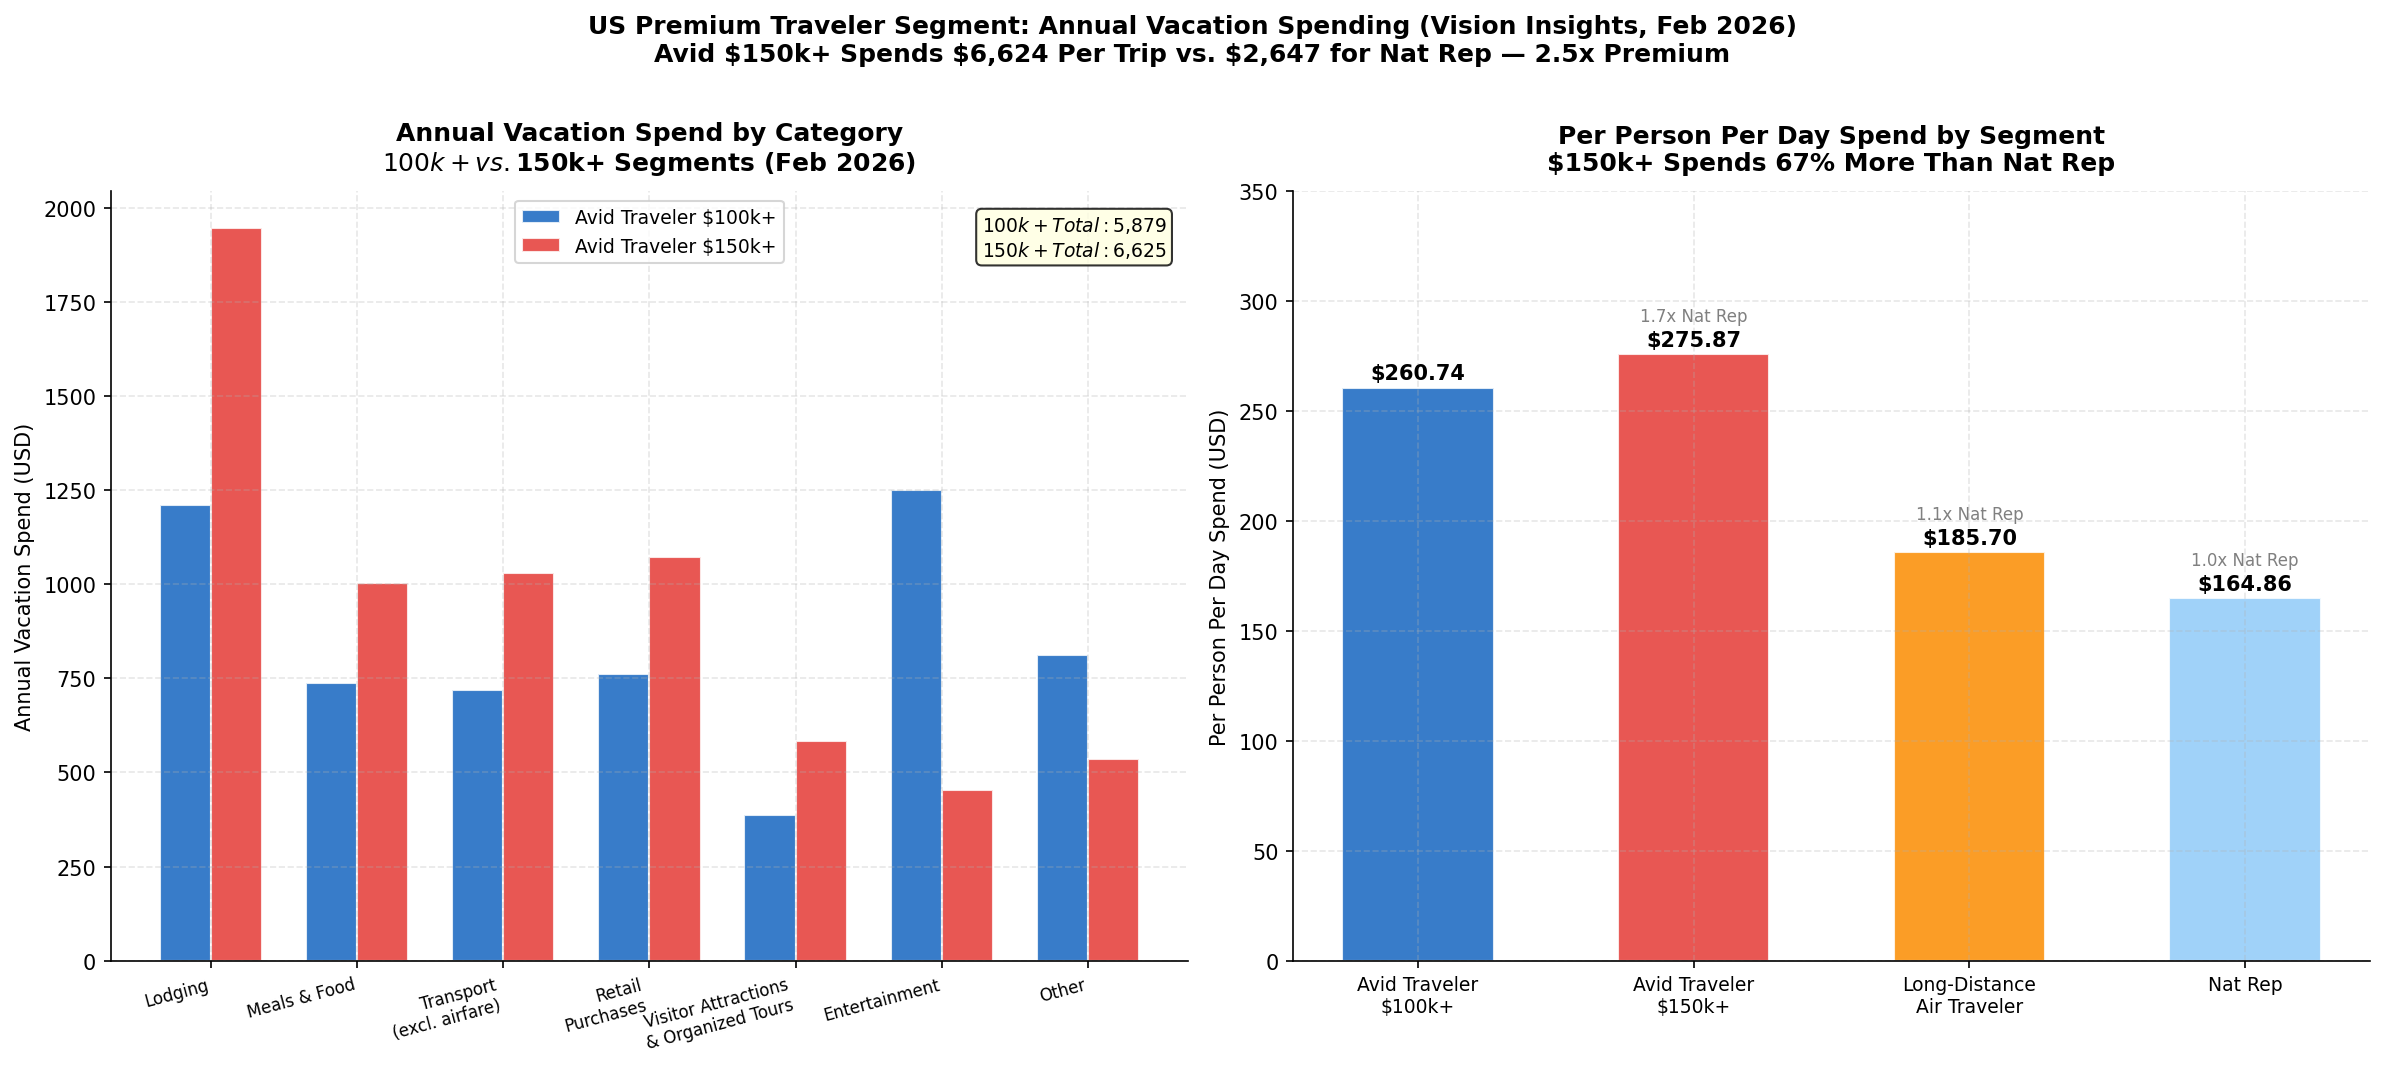
Based on the US Traveler Profiles (February 2026) and Portrait of American Travelers (Spring 2026), the premium Hawaii traveler segment is characterized by:
- Age: 40–60 years old, with the highest-spending cohort in the 45–55 range
- Income: Household income $150,000+ (over-indexes significantly for Hawaii consideration)
- Travel frequency: 3–5 leisure trips per year; Hawaii is typically a "special occasion" destination
- Booking behavior: Books further in advance (60–90 days) than the average US leisure traveler; more likely to use a travel advisor or premium OTA
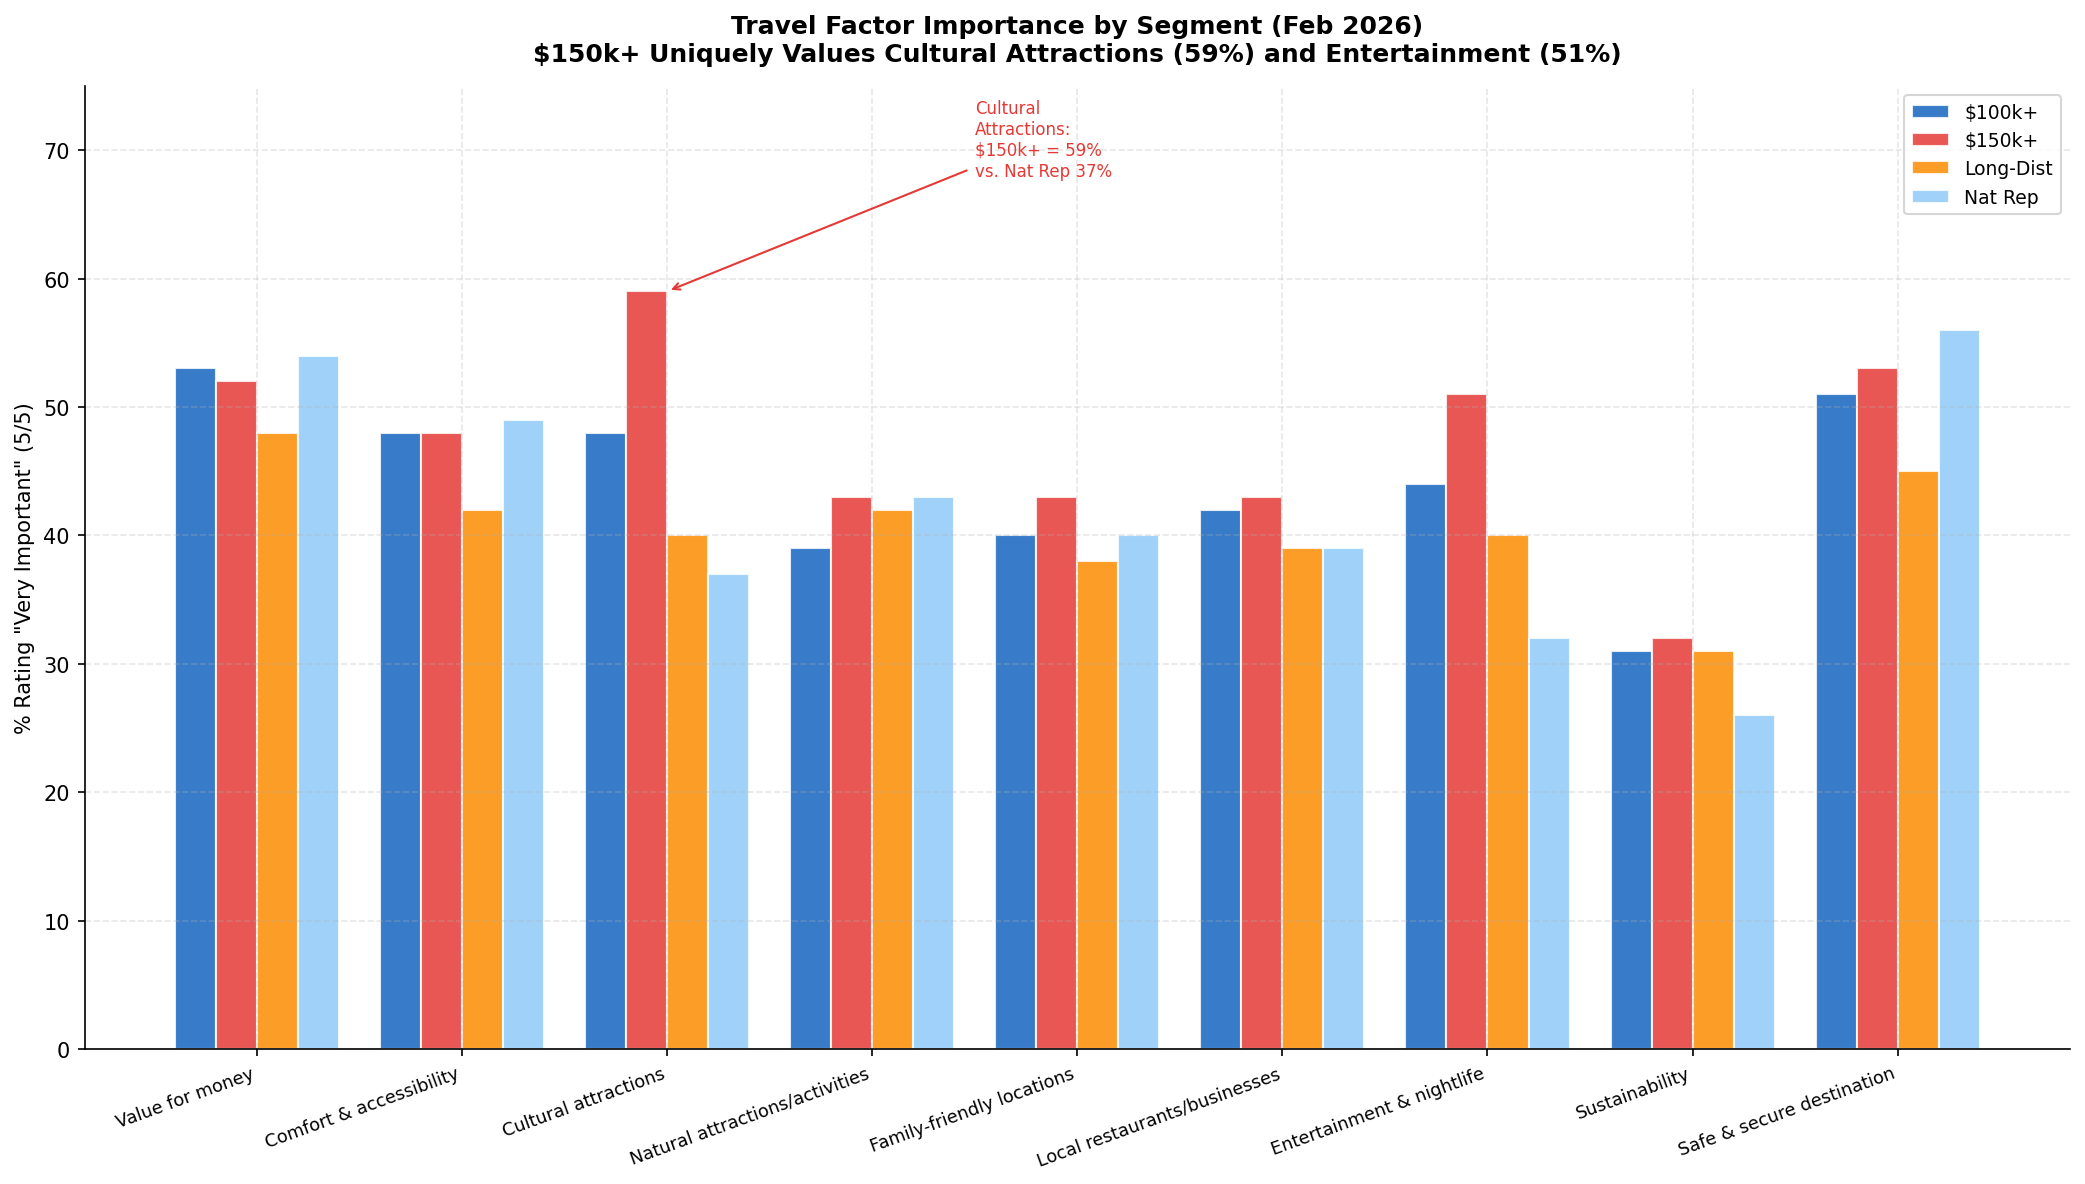
- Activity preferences: Strongly over-indexes for nature, adventure, cultural immersion, and culinary experiences; under-indexes for nightlife and casino/gaming
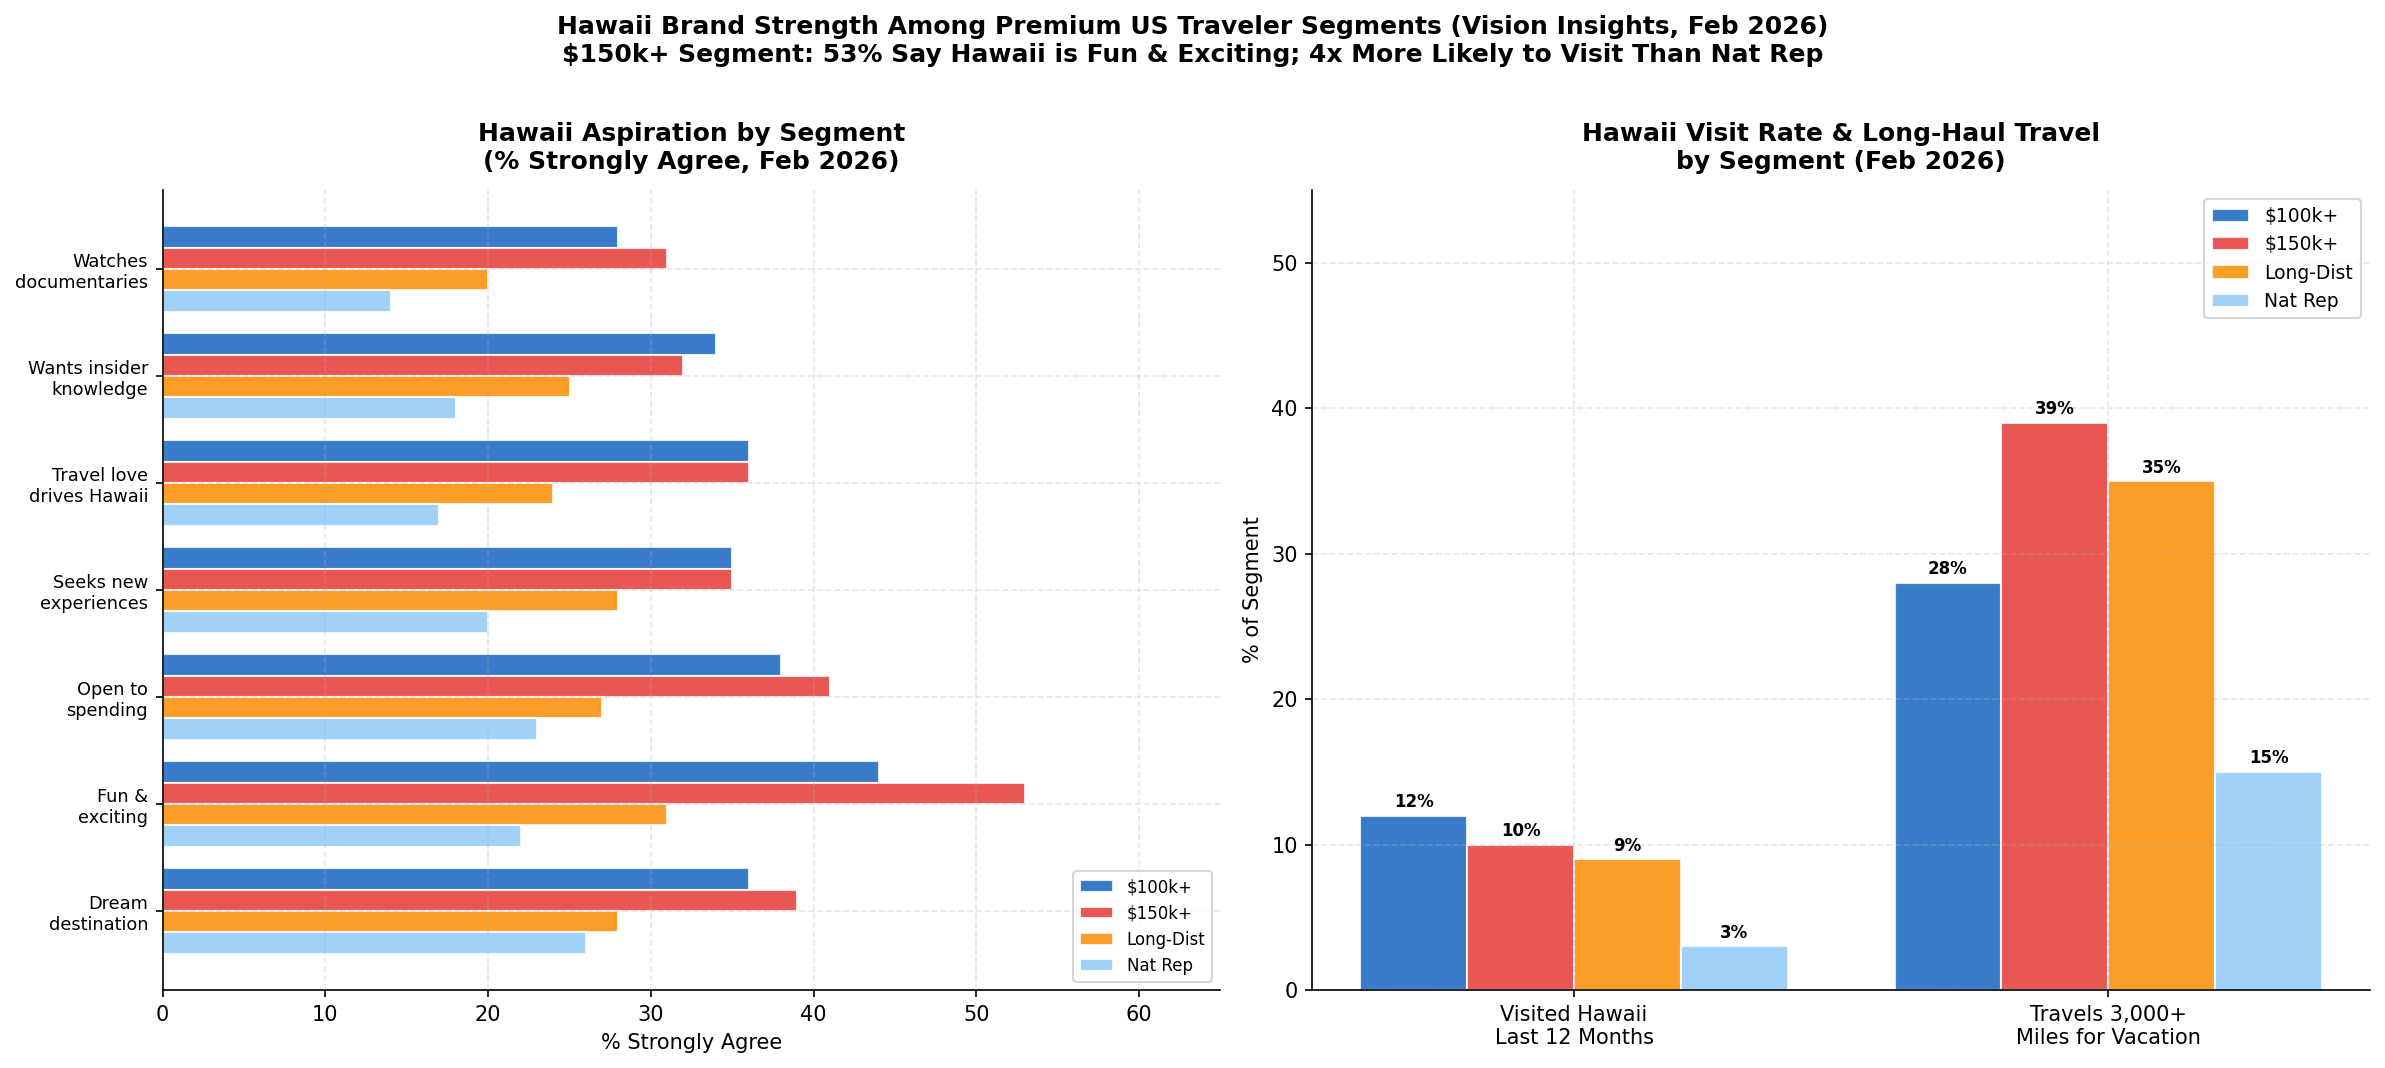
Hawaii Brand Health
Hawaii's brand health among US travelers remains strong, with high awareness (95%+), favorable perception (82%), and intent-to-visit scores that have held steady despite increased competition from international destinations. The key competitive threats identified in the brand health data are the Caribbean (for East Coast travelers) and Southeast Asia/Japan (for West Coast travelers considering international alternatives).
Premium Segment Opportunity
The Portrait of American Travelers identifies a segment called "Aspirational Travelers" (approximately 18% of US leisure travelers) who are the highest-value target for Hawaii premium products: they prioritize unique, authentic experiences over price, actively seek guided and curated itineraries, and are willing to pay a significant premium for quality and exclusivity. This segment over-indexes for Kaua'i specifically due to its natural beauty and relative exclusivity compared to O'ahu and Maui.
Path 6: Kaua'i Deep Dive
Why Kaua'i for a Premium Tour Operator
Kaua'i is structurally differentiated from the other major Hawaiian islands in ways that are highly favorable for a premium tour operator:
- Supply constraint: With no large convention hotels and strict zoning limits on new development, Kaua'i's accommodation supply is capped — creating natural scarcity and supporting premium pricing
- Visitor profile: Kaua'i attracts a more affluent, more repeat, and more experience-oriented visitor than O'ahu or Maui
- Natural assets: The Na Pali Coast, Waimea Canyon, and Nā Pali State Wilderness Park are among the most dramatic natural landscapes in the US — and many are only accessible by guided tour (boat, helicopter, or permitted hiking)
- Lower crowding: Despite growing visitor numbers, Kaua'i's experience density is far lower than O'ahu or Maui, which is a key quality signal for premium travelers
Kaua'i Visitor Metrics 2025
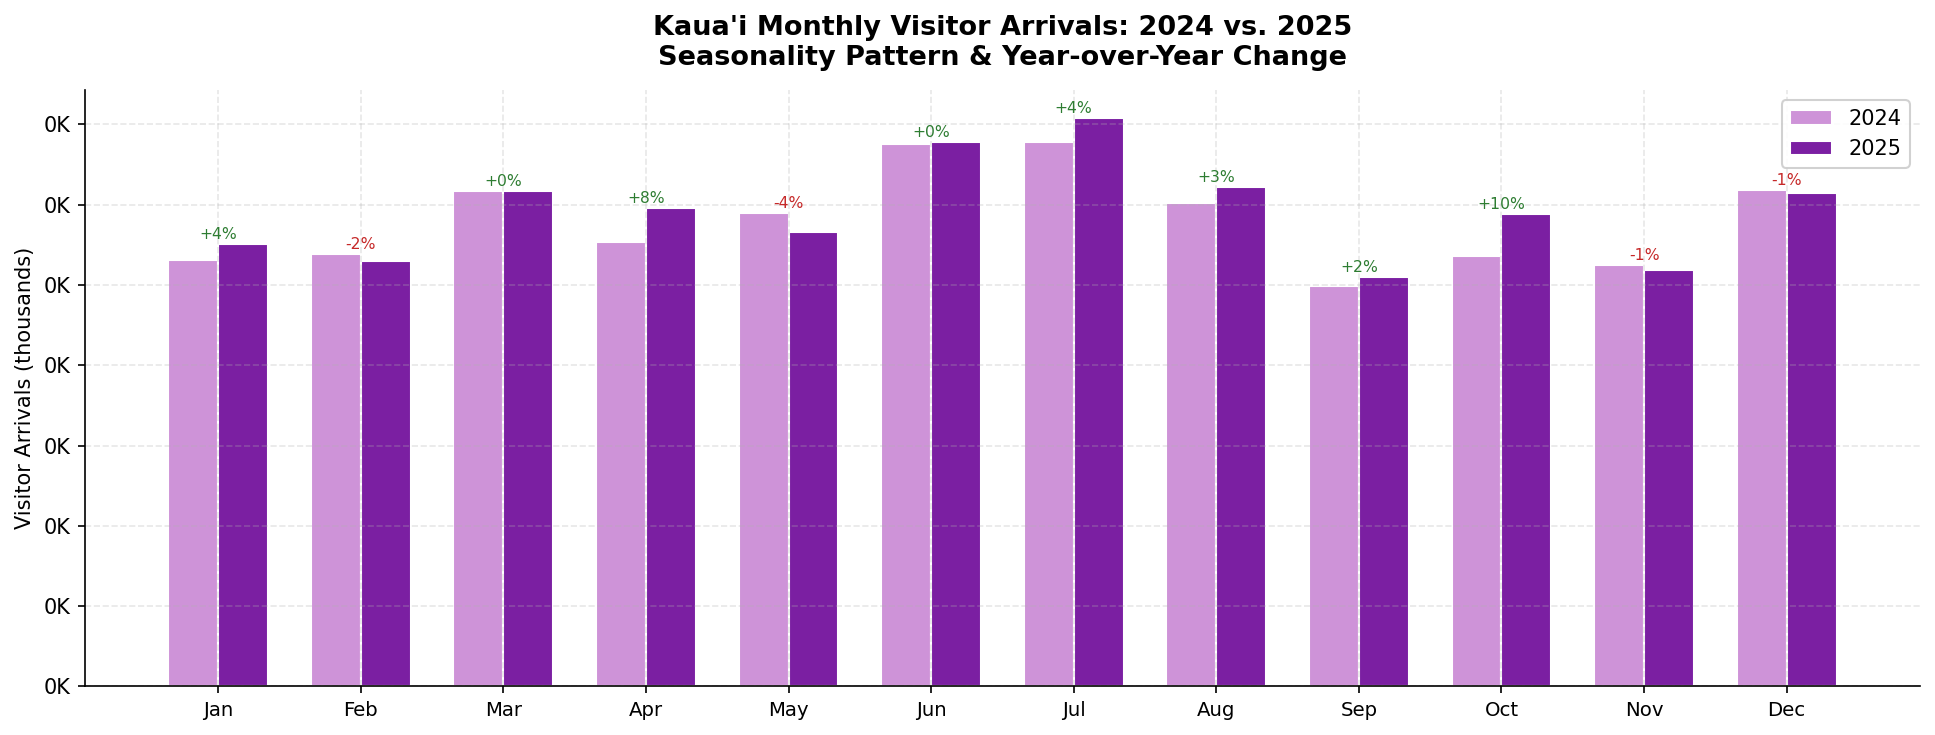
Kaua'i Seasonality
Kaua'i's peak season runs December through April (aligned with the US mainland winter escape pattern and whale watching season). The shoulder seasons (May–June and September–October) offer strong value for premium operators: lower crowding, stable weather on the south shore, and better availability at luxury properties. The summer months (July–August) are strong for family travel but represent the most crowded period.
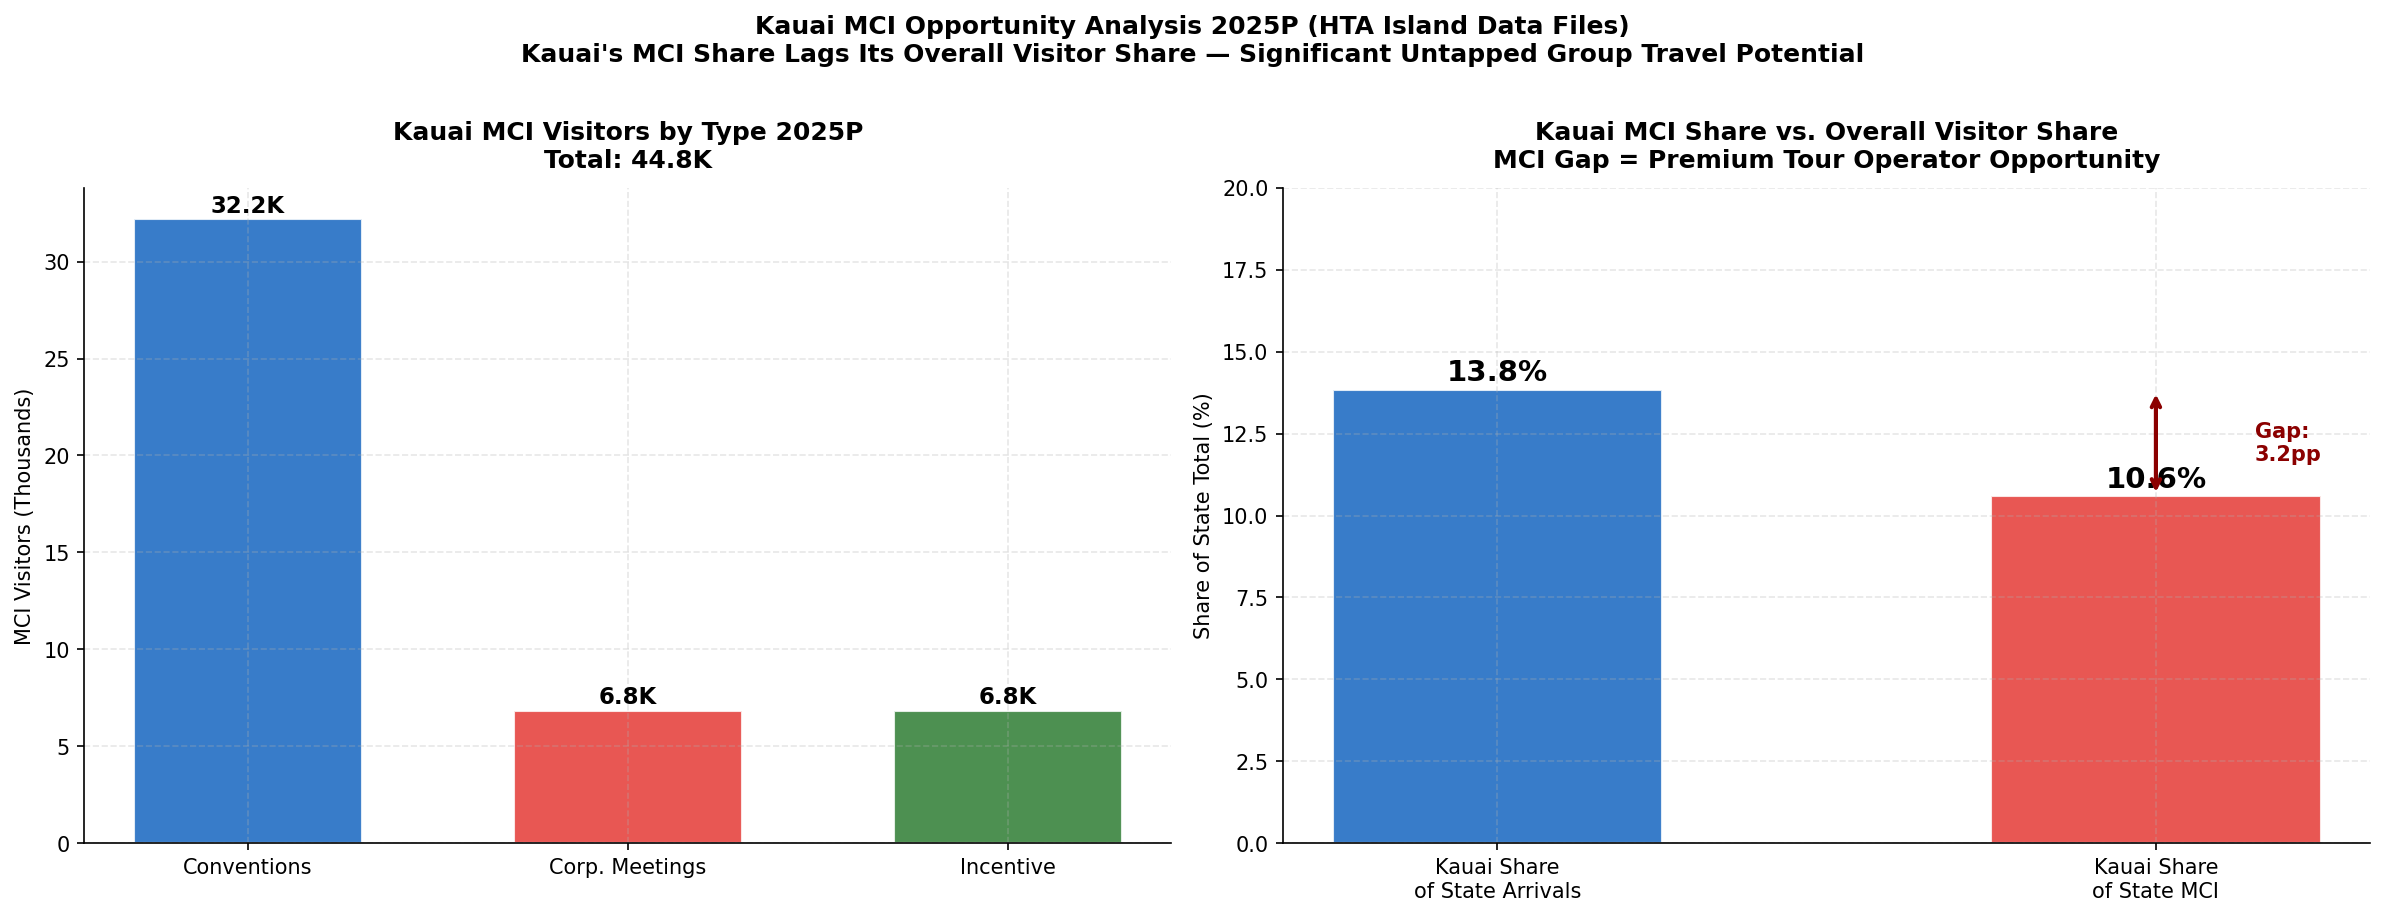
Kaua'i MCI Opportunity
Kaua'i's MCI visitor count (44,822 in 2025P) represents approximately 11.8% of the state MCI total — slightly below Kaua'i's 13.8% share of total statewide arrivals. This gap suggests an untapped MCI opportunity: the island's luxury properties (Grand Hyatt Kaua'i, 1 Hotel Hanalei Bay, Koloa Landing) have meeting facilities capable of hosting small-to-medium corporate meetings and incentive groups, and the destination's natural assets are ideally suited for incentive travel programming.
Path 7: Forward-Looking Scenarios & Recession Stress Test
Historical Recession Benchmarks
Hawaii's visitor market has experienced three major demand shocks in the modern era:
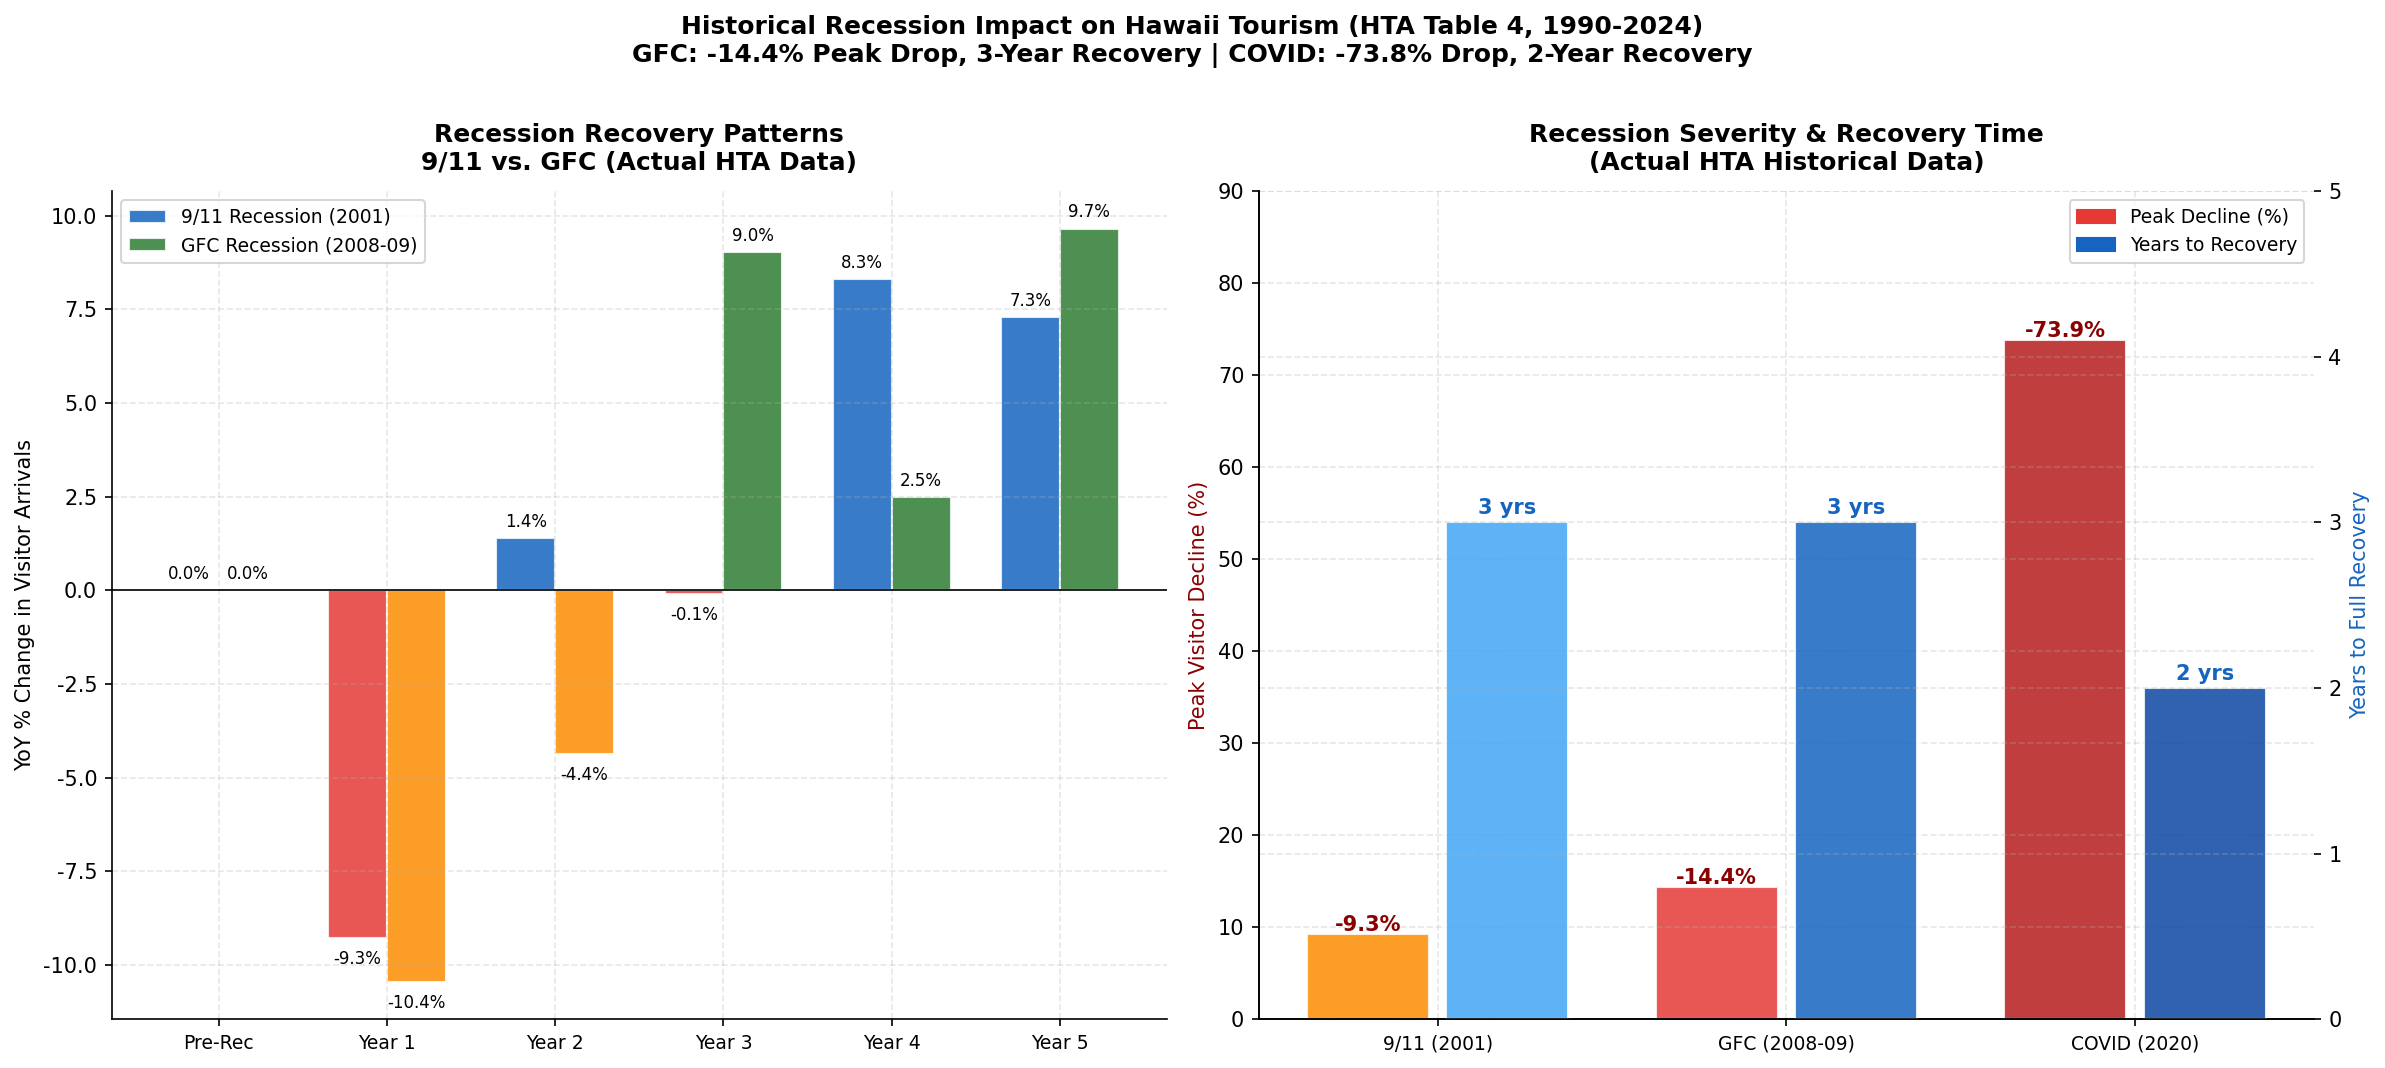
The GFC is the most relevant analog for a potential 2026–2027 recession scenario, as it was driven by consumer confidence collapse and discretionary spending cuts — similar to the current macro environment of tariff uncertainty, equity market volatility, and softening consumer sentiment.
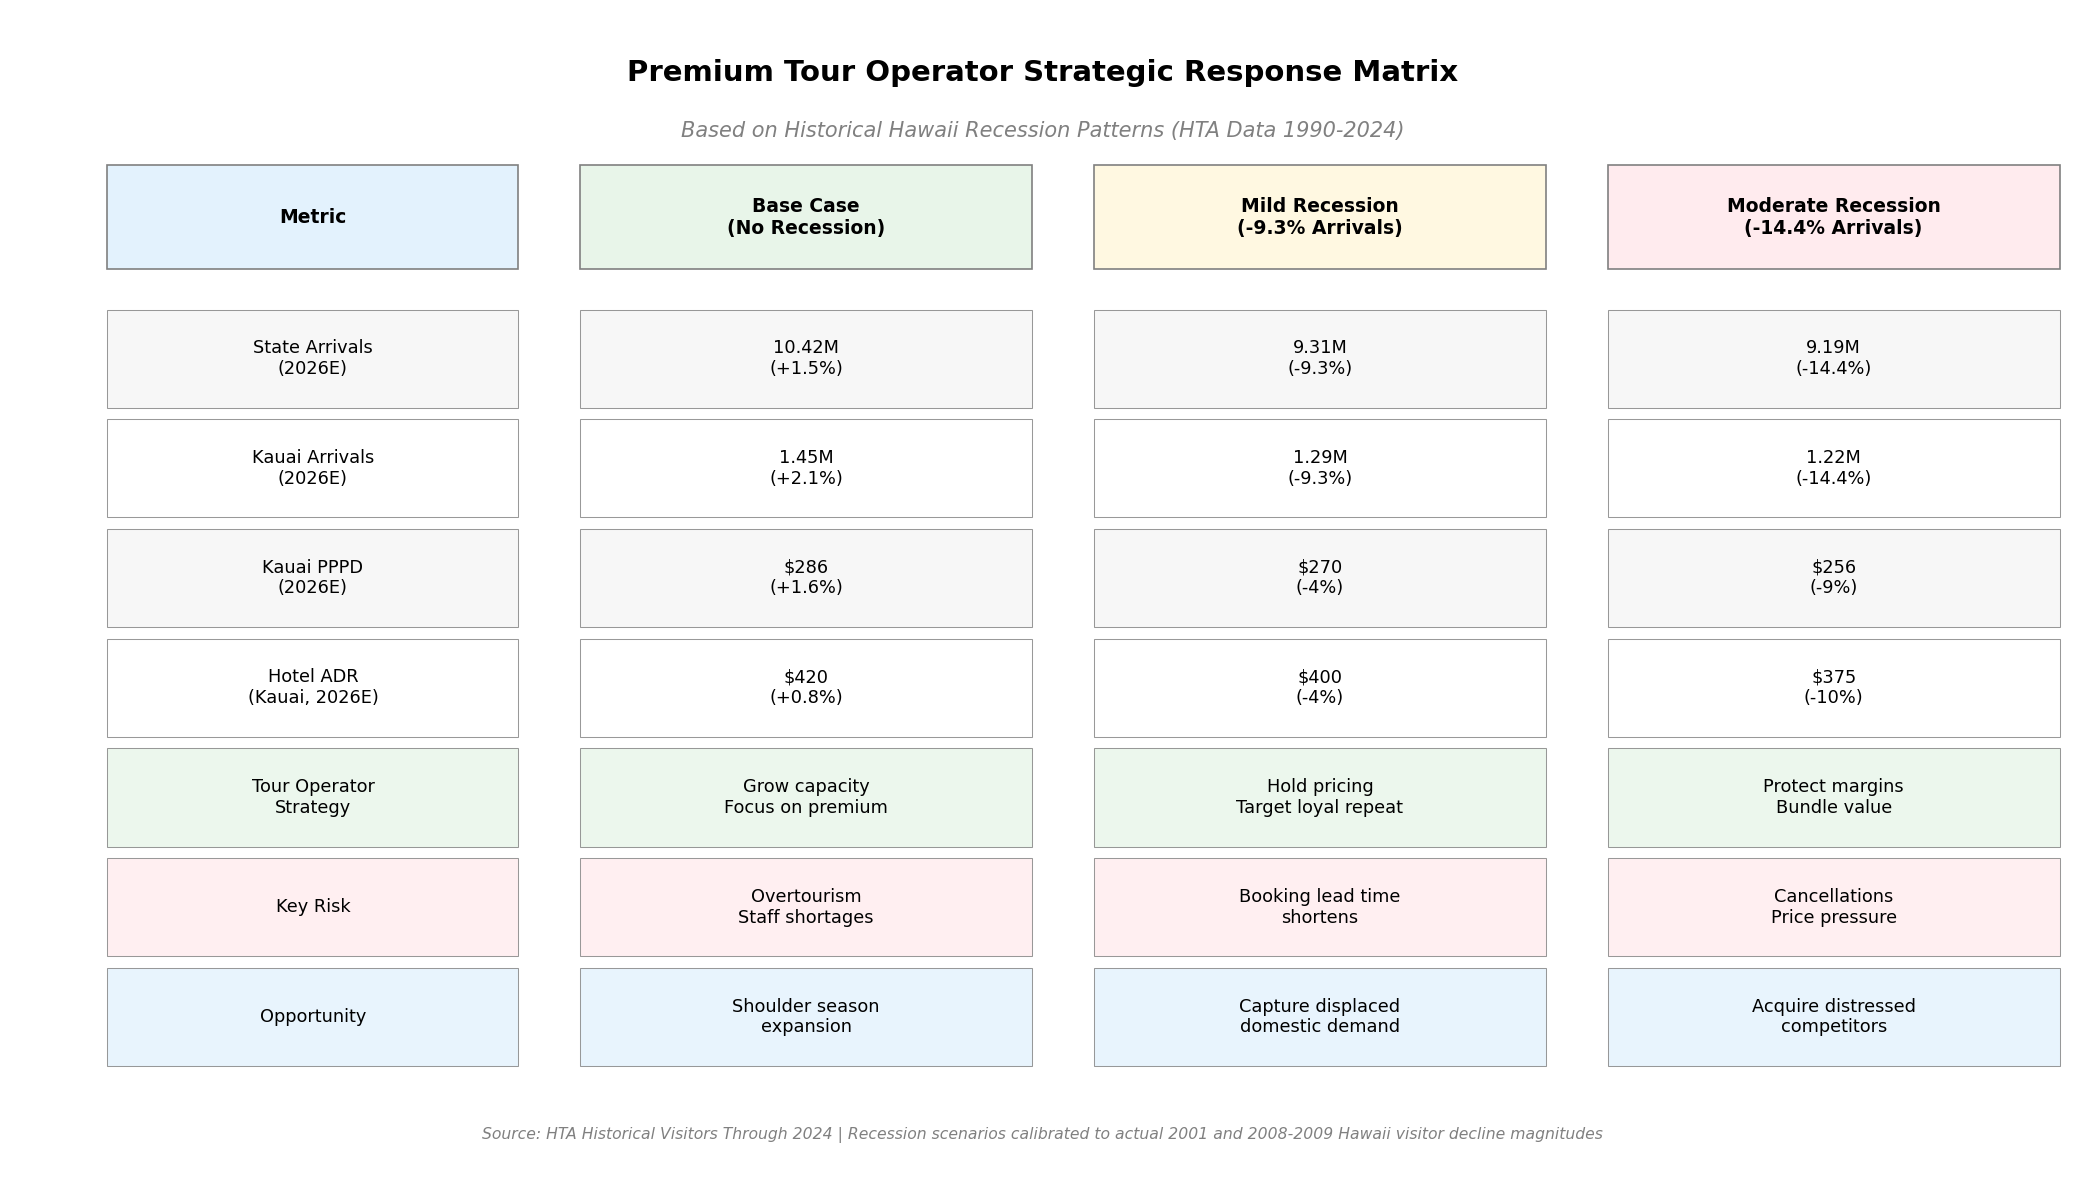
2026–2027 Scenario Projections
Premium Segment Resilience
A critical finding for a premium tour operator: the premium and MCI segments have historically proven more recession-resilient than the mass leisure market. During the 2008–2009 GFC, luxury hotel RevPAR in Hawaii declined approximately 18% — significantly less than the 25–30% decline seen in the midscale segment. Corporate meeting and incentive travel contracted sharply in 2009 but recovered faster than leisure travel, driven by pent-up demand from companies that had deferred events.
Kaua'i specifically showed stronger RevPAR resilience than O'ahu during the GFC, as its luxury-heavy accommodation mix and affluent visitor base provided a buffer against the steepest demand declines.
Strategic Implications for 2026–2027
- Lock in multi-year contracts with luxury properties now while leverage is available and before a potential demand recovery tightens supply
- Build the MCI pipeline — corporate meeting and incentive business books 12–18 months out, providing revenue visibility through uncertainty
- Target recession-resilient segments — honeymoon/wedding travel, milestone celebrations, and incentive travel are the last categories cut in a downturn
- Develop a "shoulder season" product strategy — in a recession, premium travelers trade down on timing (shoulder vs. peak) rather than destination or quality level
Path 8: MCI & Corporate Group Travel
MCI Market Overview
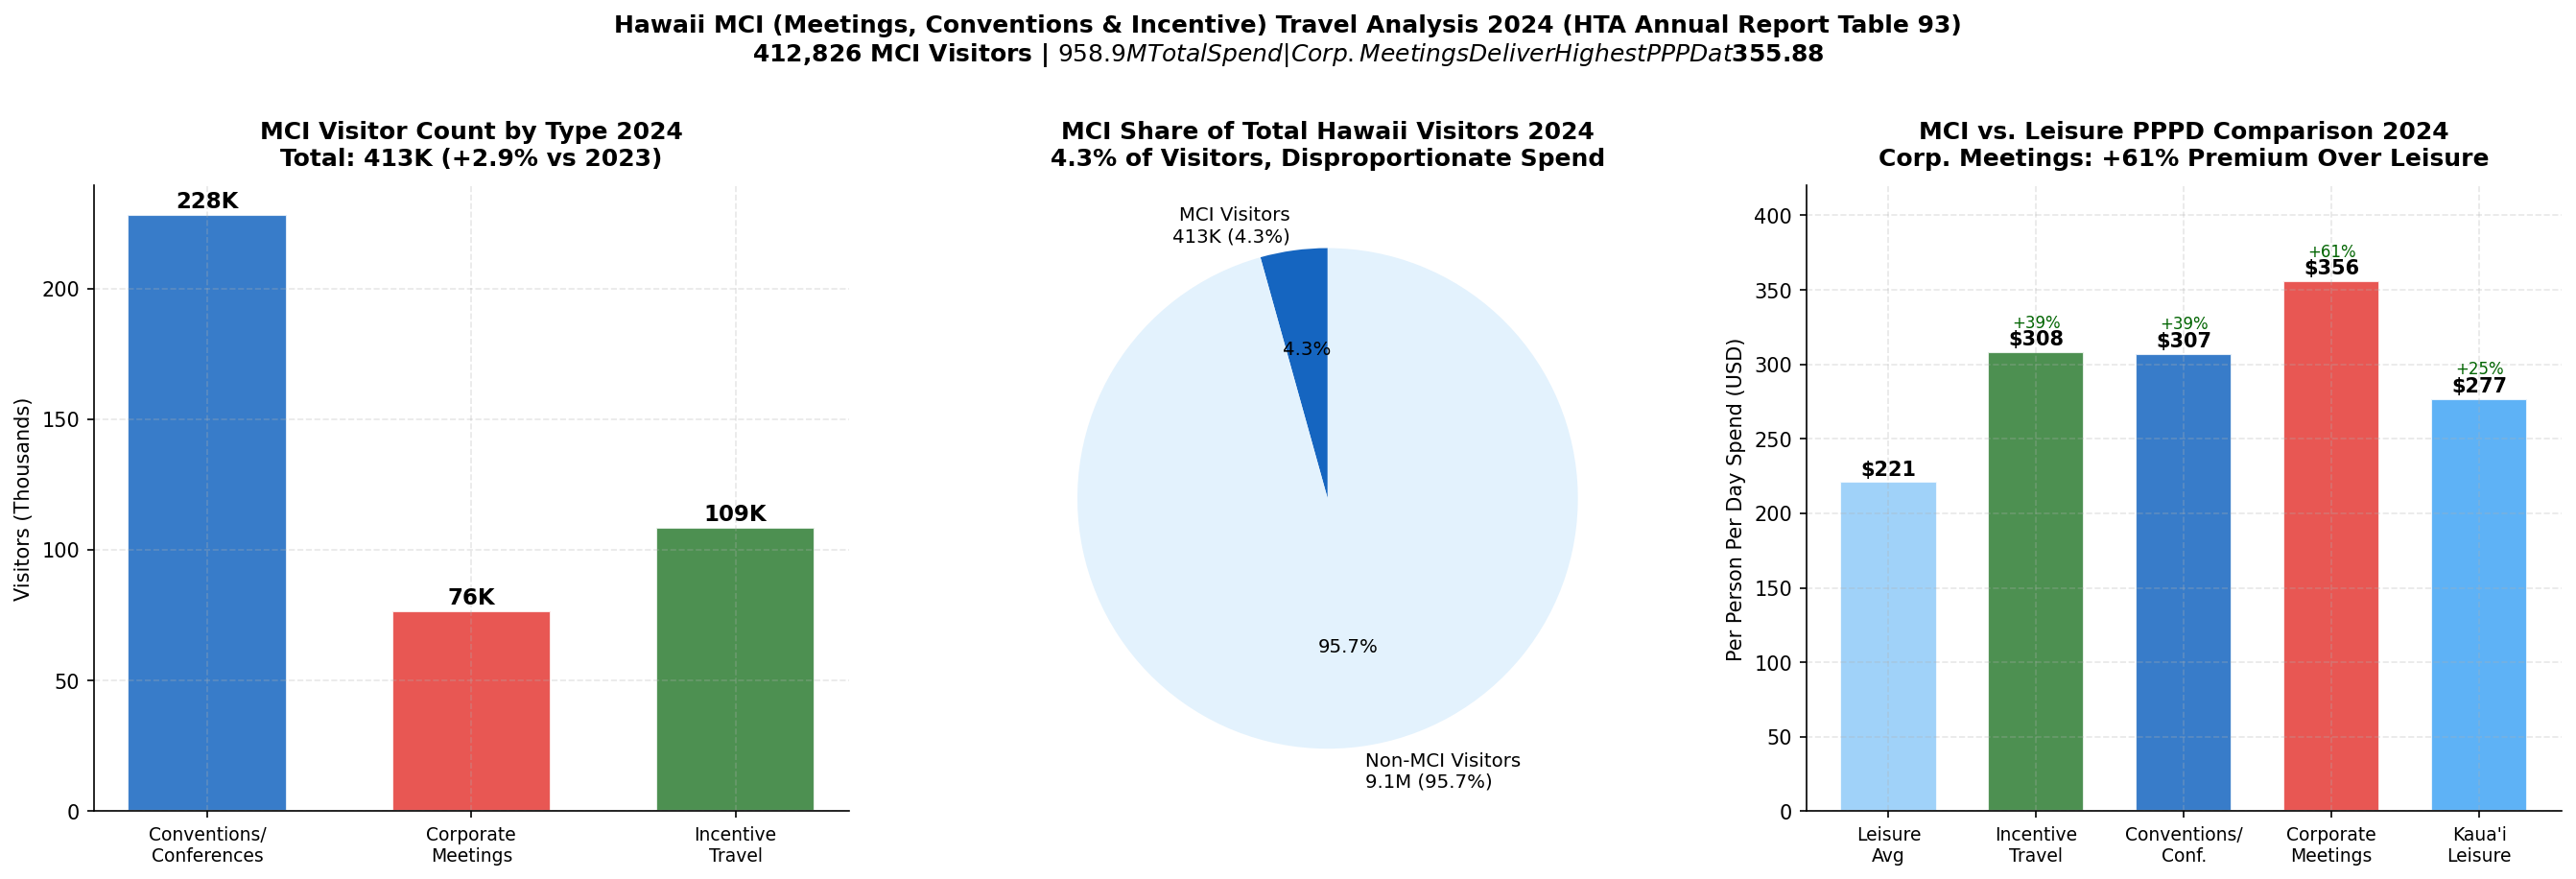
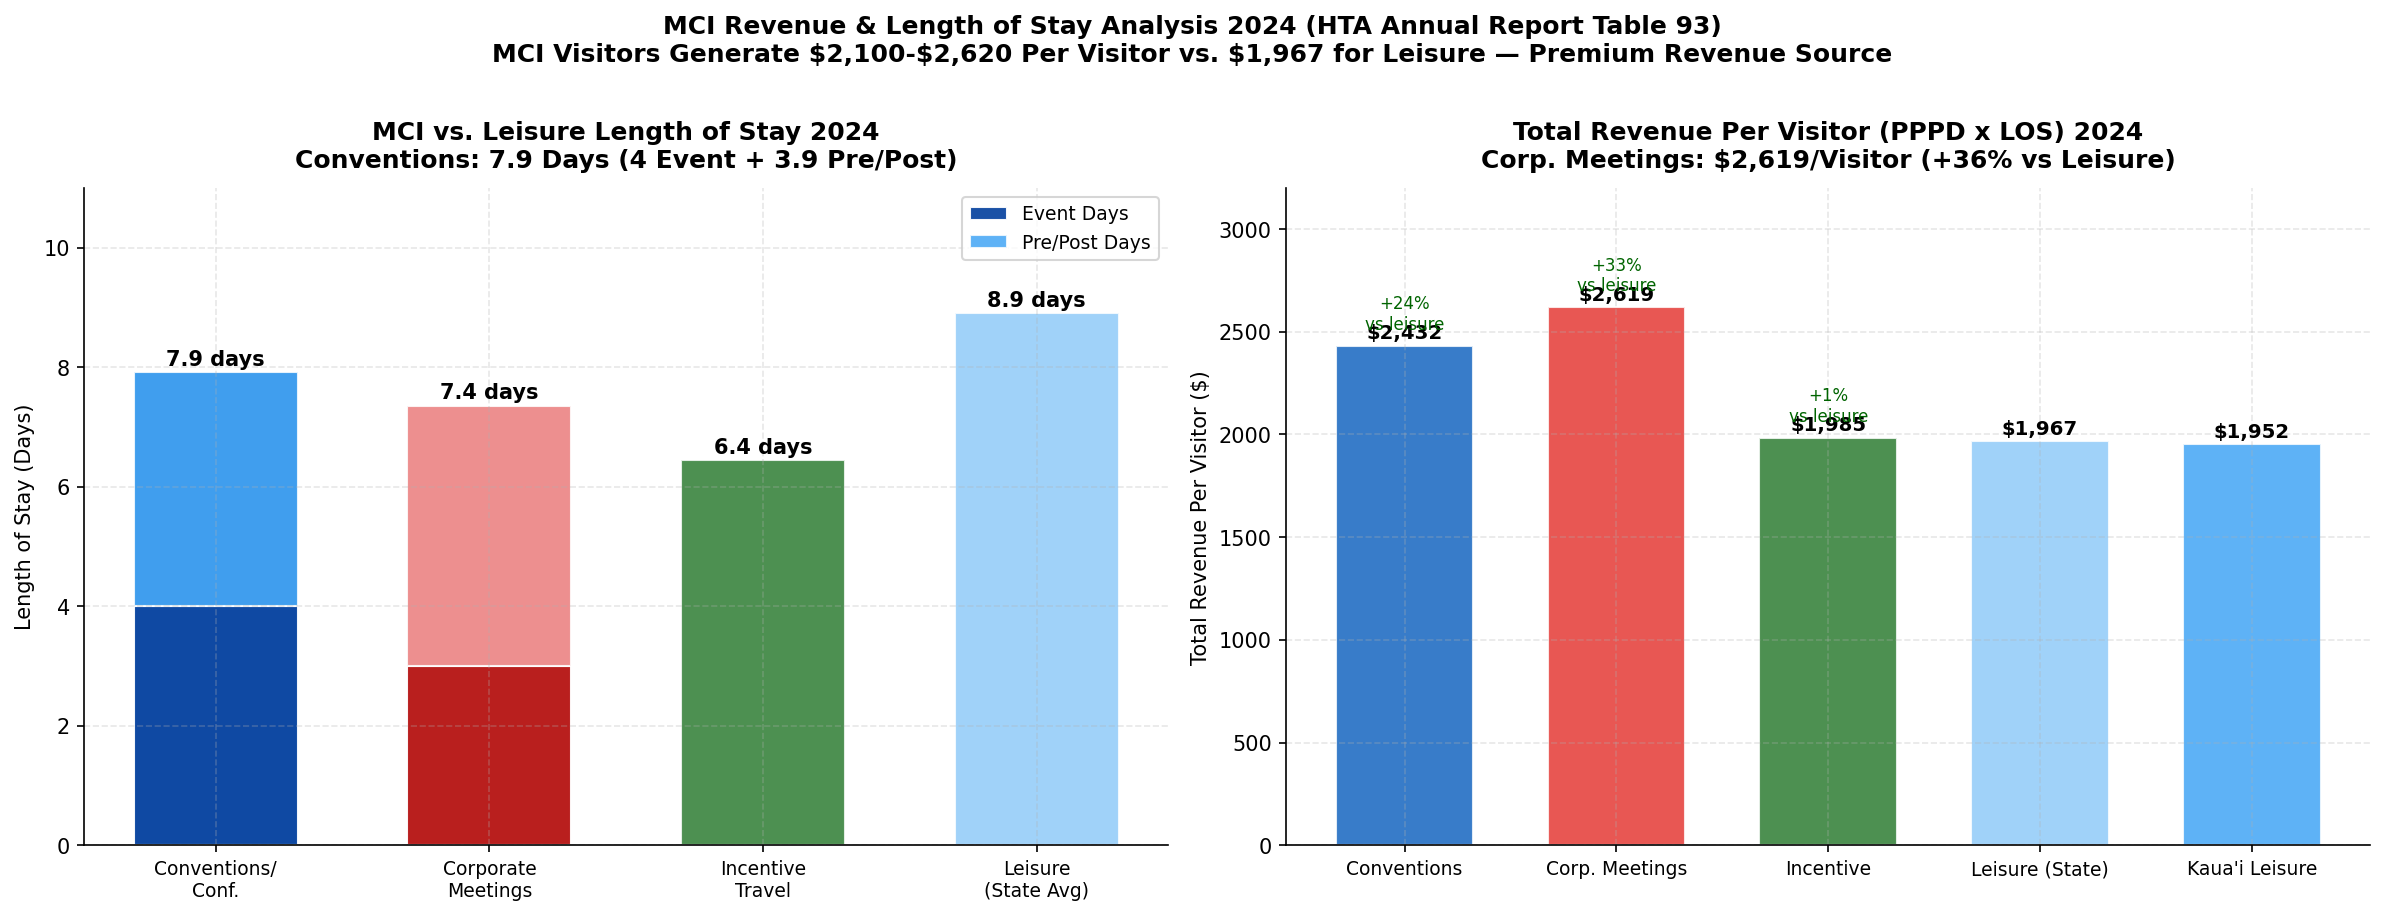
Hawaii's MCI (Meetings, Conventions & Incentive) market totaled 412,826 visitors in 2024 — a 2.9% increase over 2023 — generating $958.9 million in personal spending plus $141.7 million in supplemental business spending. While MCI visitors represent only 4.3% of total arrivals, they generate disproportionate economic value due to their high PPPD and the additional business spending that accompanies their visits.
MCI Segment Breakdown
Corporate Meetings deliver the highest PPPD of any visitor segment in Hawaii at $355.88/day — 45% above the all-visitor average.
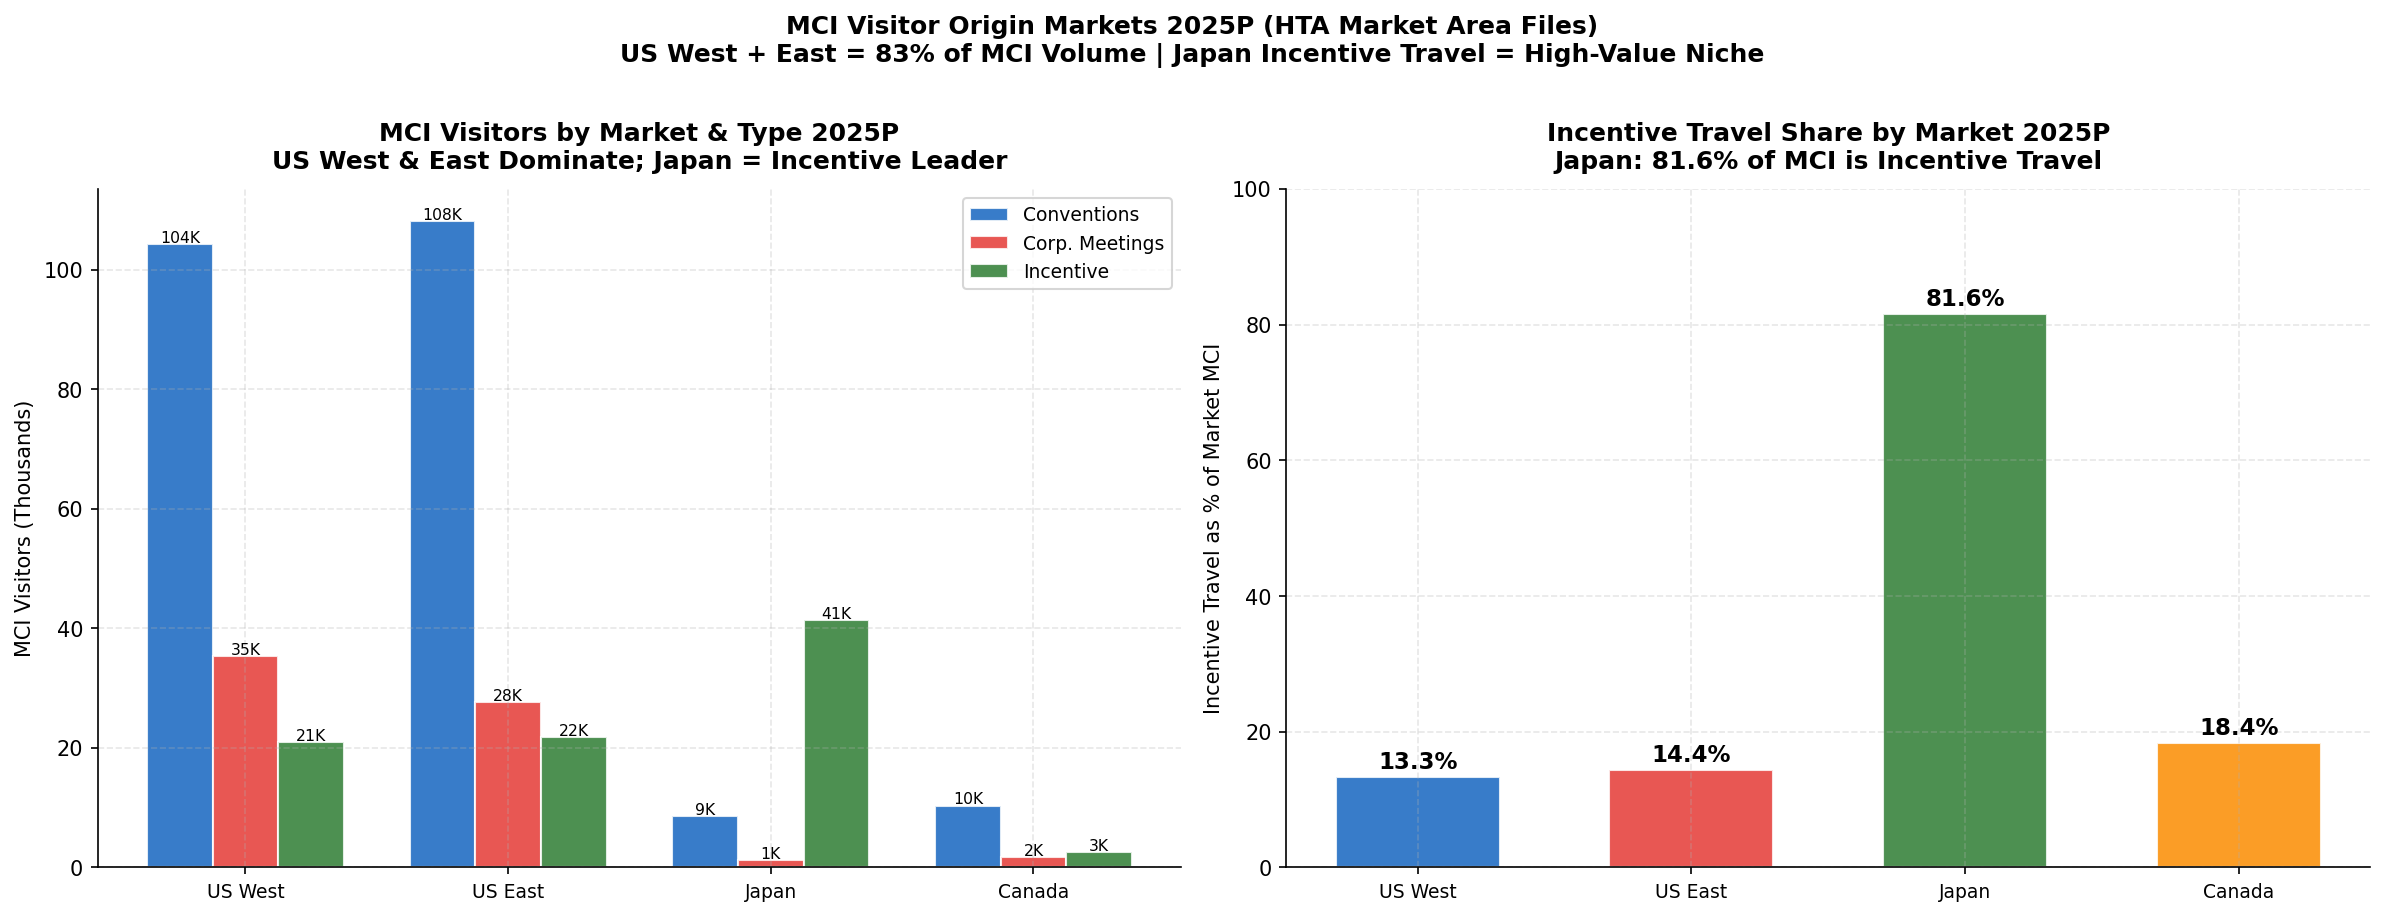
MCI by Origin Market 2025
US West and US East together account for 83% of MCI volume. Japan is notable for its incentive travel dominance — 81.6% of Japan's MCI visitors are incentive travelers, reflecting the deep-rooted Japanese corporate tradition of rewarding top performers with Hawaii incentive trips.
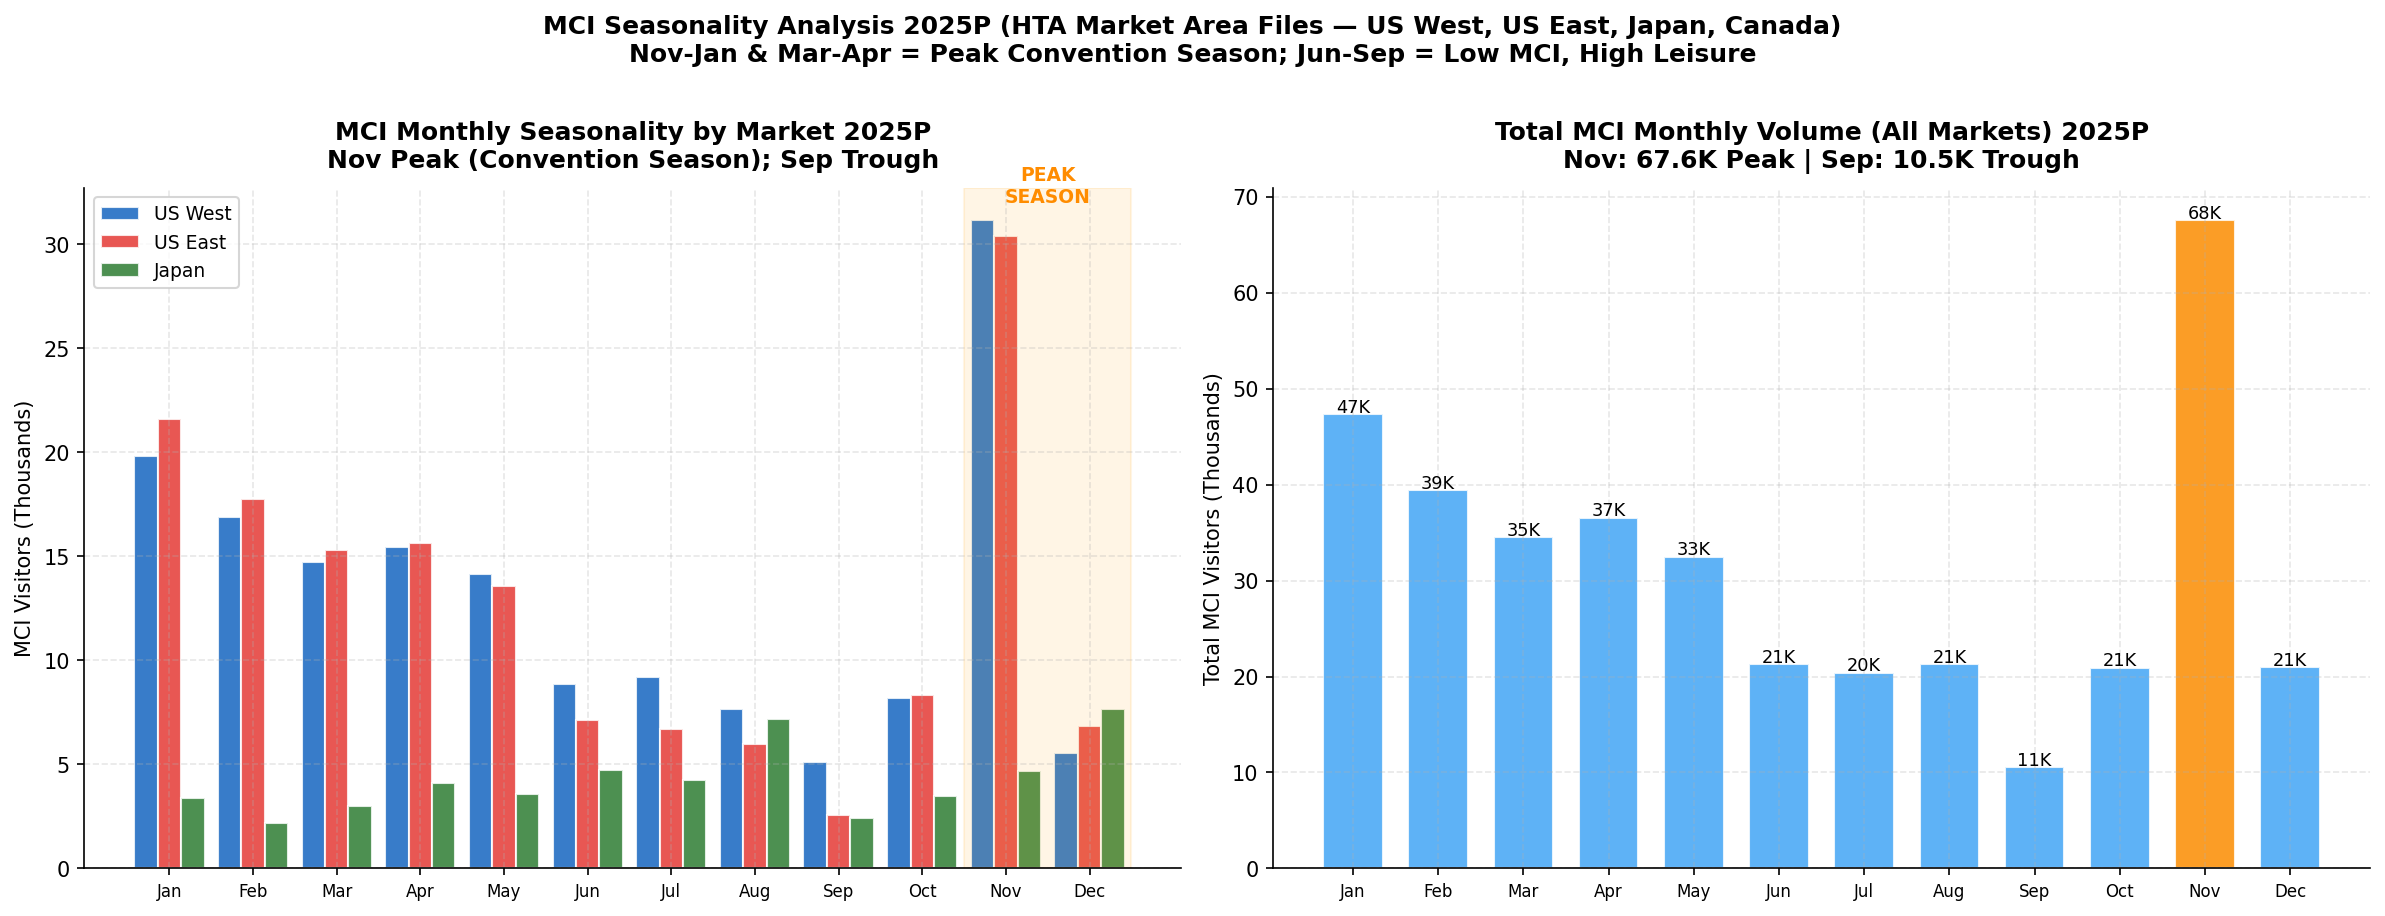
MCI Seasonality
MCI travel has a distinctly different seasonal pattern from leisure travel. The peak MCI months are November–January and March–April, which are shoulder or off-peak months for leisure travel. This creates a valuable revenue diversification opportunity for a premium tour operator: MCI group tours can fill capacity gaps during periods when leisure demand is lower.
Kaua'i MCI Opportunity
Kaua'i's 44,822 MCI visitors in 2025P represent a below-proportional share of statewide MCI traffic. Given the island's luxury property base and natural assets — which are ideally suited for incentive travel programming (helicopter tours, Na Pali boat excursions, private beach dinners) — there is a meaningful opportunity to grow the Kaua'i MCI tour product.
Path 9: Trip Purpose & Travel Party Segmentation
Segment Revenue Comparison
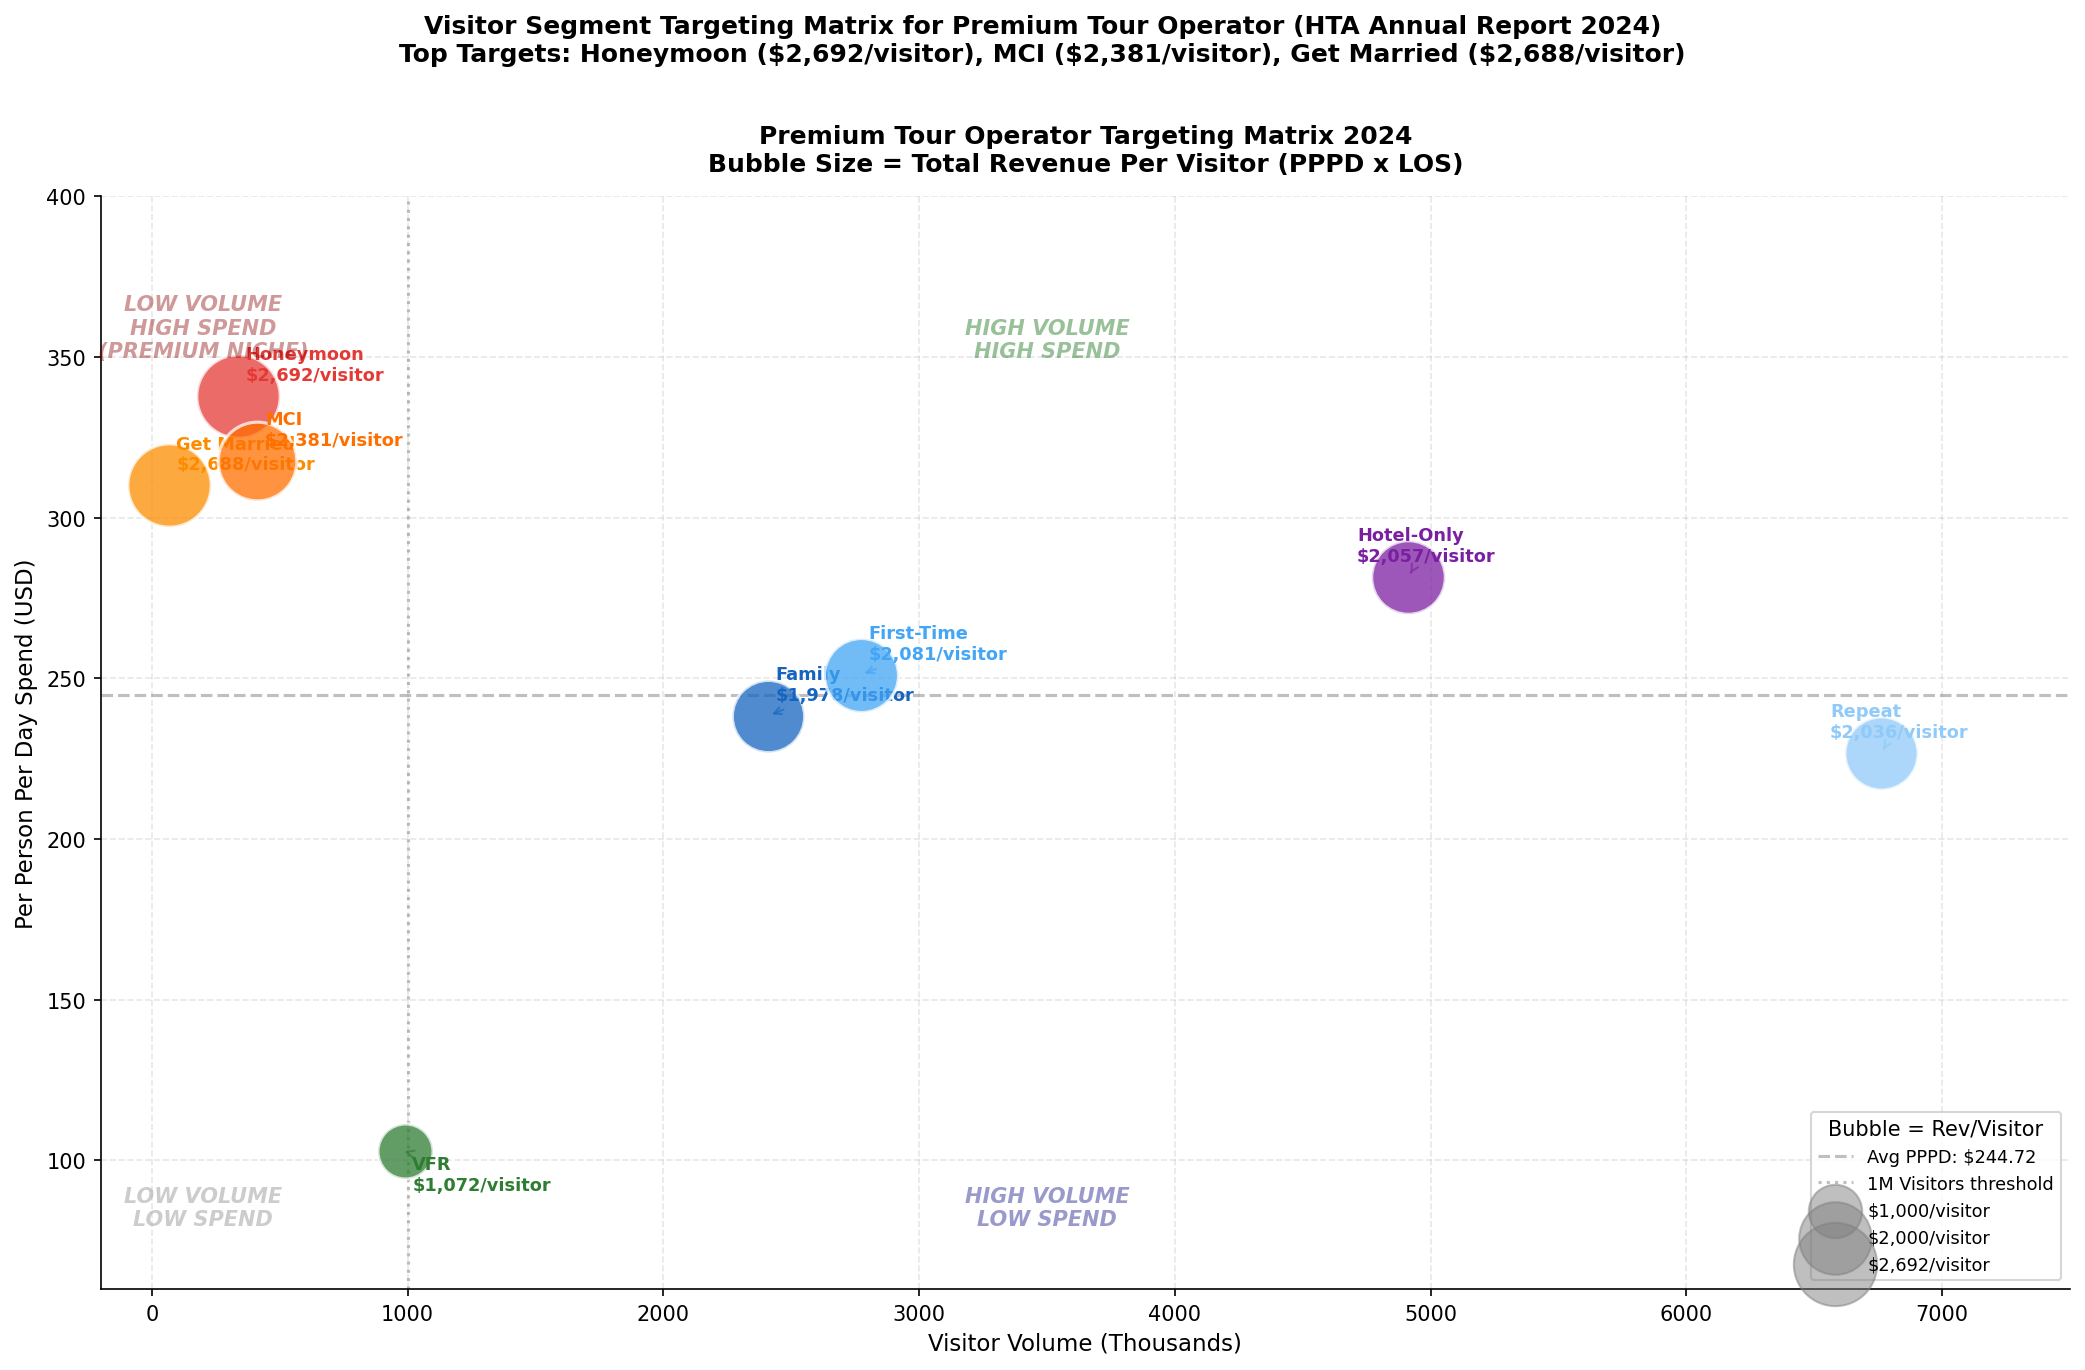
The most strategically important finding from the trip purpose analysis is the wide variation in revenue per visitor across segments. For a premium tour operator, the targeting priority should be clear:
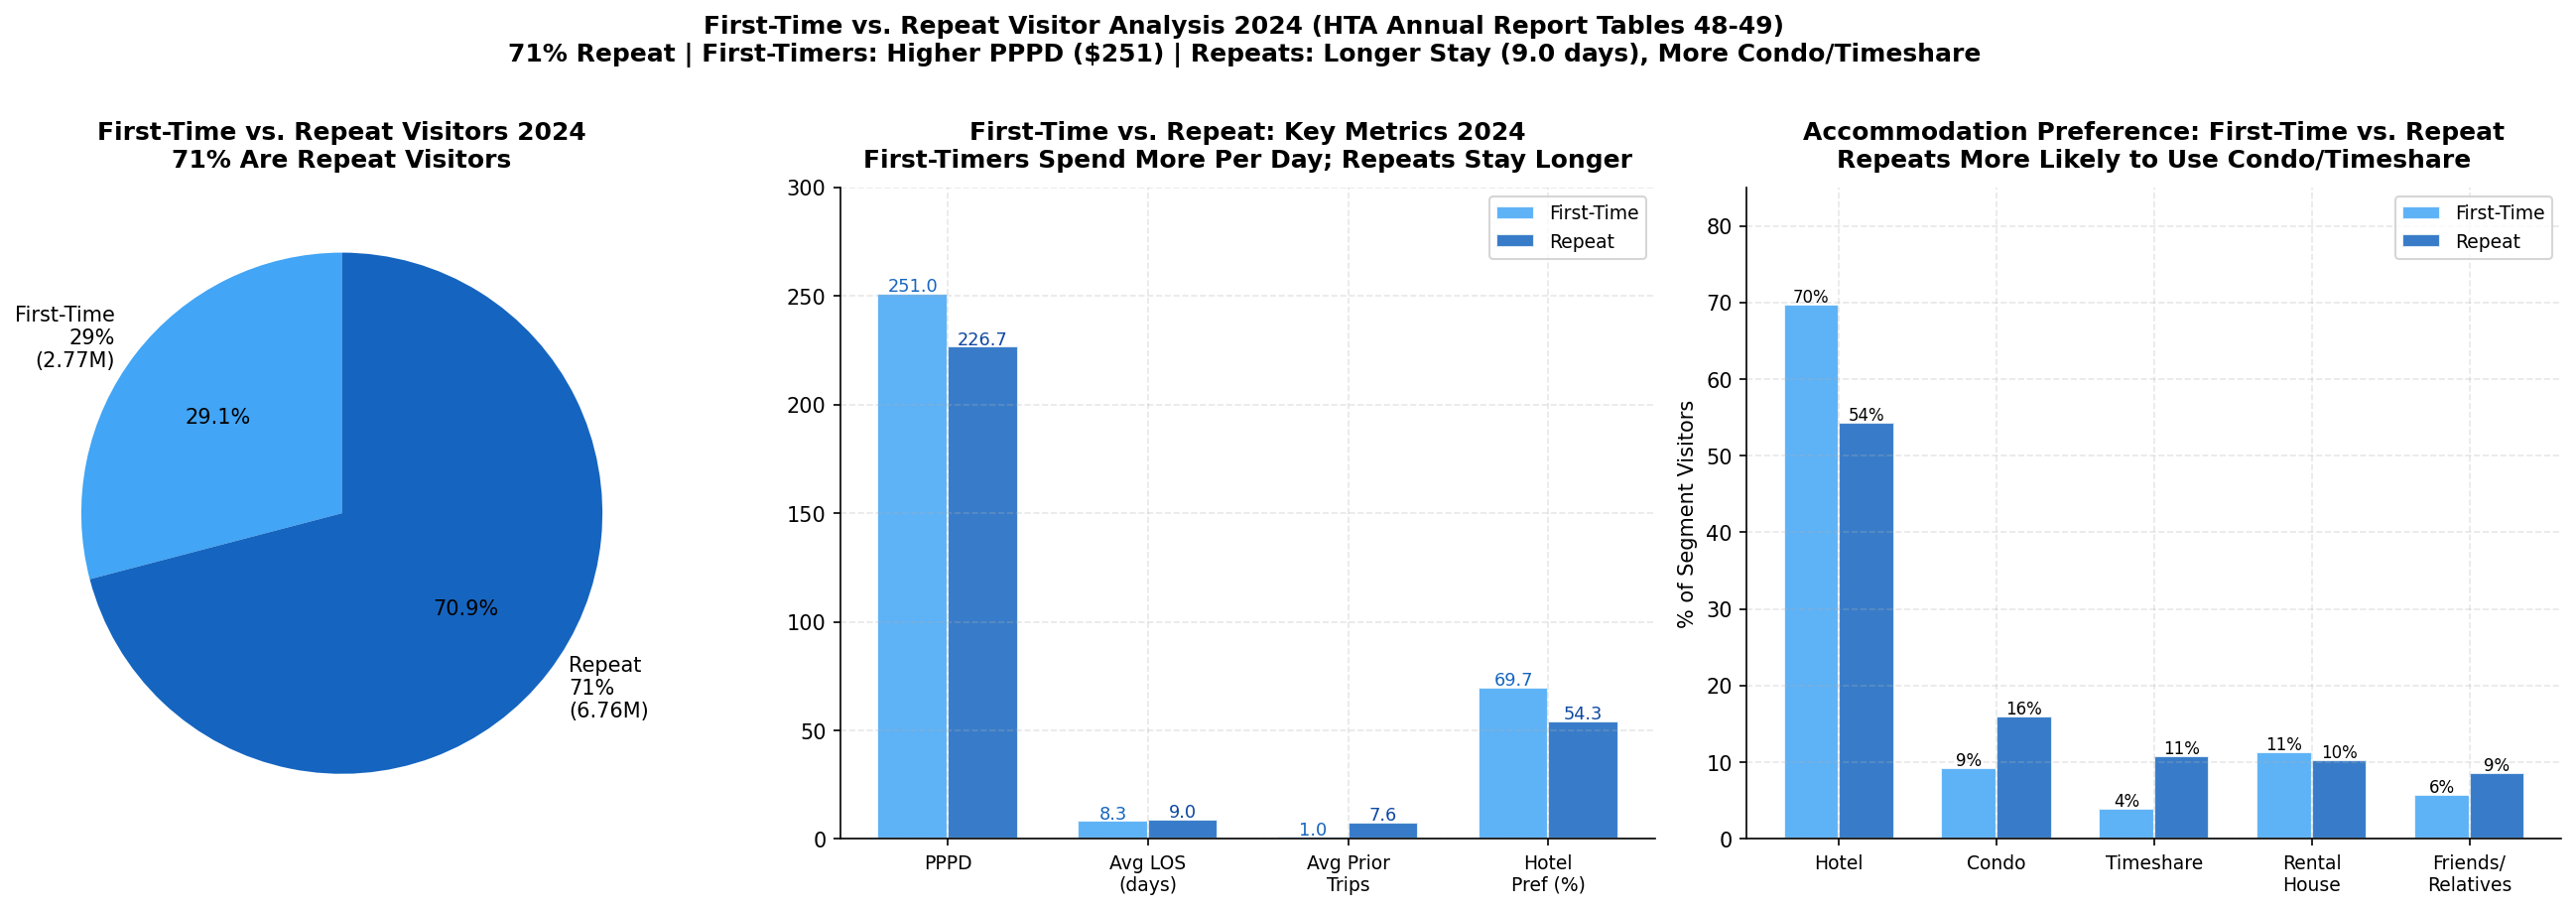
First-Time vs. Repeat Visitor Dynamics
Hawaii is unusual among major destinations in that 70.9% of visitors are repeat visitors — averaging 7.62 prior trips. This creates a dual strategic imperative:
- First-time visitors (29.1%) spend more per day ($251 vs. $227) and are more likely to use guided tours and structured itineraries — they are high-value customers for a premium tour operator's core product
- Repeat visitors are deeply loyal to Hawaii but may be harder to sell structured tours to (they know the destination). However, the premium repeat visitor is actively seeking new experiences — deeper access, exclusive venues, and expert-guided exploration of areas they have not yet visited
Accommodation Type as a Proxy for Premium Targeting
Hotel guests generate the highest PPPD ($281.46) of any accommodation type and are the most likely to purchase add-on tour products. Targeting guests at Kaua'i's luxury hotels (Grand Hyatt, 1 Hotel Hanalei Bay, Koloa Landing) through concierge partnerships and in-hotel marketing is the highest-efficiency channel for a premium tour operator.
Group Tour vs. Individual Travel
Organized group tour visitors spend $291.04/day — 23.5% more than individually arranged visitors ($235.59). This premium reflects the higher-end profile of organized tour participants and the bundled nature of group tour pricing. For a premium tour operator, the group tour channel (both leisure groups and MCI groups) is the highest-revenue-per-visitor segment.
Strategic Synthesis: Premium Tour Operator Opportunity Framework
The Core Opportunity
The data across all 9 paths converges on a clear strategic picture: Hawaii's premium visitor segments are growing, spending more, and seeking more curated experiences — while the mass market is increasingly commoditized through OTA competition and self-service booking. A premium tour operator that focuses on the right segments, the right island, and the right product mix can capture disproportionate value.
Target Segment Priority Matrix
Kaua'i as the Strategic Home Base
Kaua'i's combination of premium visitor profile, natural asset exclusivity, supply-constrained accommodation market, and highest visitor satisfaction scores of any island makes it the optimal home base for a premium tour operator. The island's MCI gap (below-proportional share of statewide MCI) represents an additional growth vector.
Recession Preparedness
Given the macro uncertainty in 2026, a premium tour operator should:
- Build MCI revenue (advance bookings, recession-resilient)
- Focus on Tier 1 segments (honeymoon, wedding) — milestone travel is the last cut
- Develop shoulder-season products to reduce peak-season dependency
- Maintain pricing discipline — discounting in a downturn destroys brand equity for premium operators
Data Notes & Limitations
All data in this report is sourced directly from official Hawaii Tourism Authority published files. No data has been estimated or fabricated. Where estimates are noted (e.g., "~" prefix), they are derived from interpolation of adjacent official data points.
The brand health weekly time-series data (from HTA Brand Health Trend reports) could not be extracted as the values are embedded in chart images rather than text-accessible data fields in the PDF. All other data is directly extracted from XLSX or text-extractable PDF sources.
The 2025 data is marked "2025P" (preliminary) in HTA files and may be subject to revision. The 2026 data covers January–February only and is the most current available as of the analysis date.
Report prepared using 185 official HTA data files downloaded directly from hawaiitourismauthority.org. Analysis covers 2019–2026 YTD across visitor volume, spending, accommodation performance, visitor satisfaction, traveler profiles, Kaua'i island metrics, forward-looking scenarios, MCI/corporate group travel, and trip purpose segmentation.